OKB up 35% in a week – Will the altcoin breakout beyond $52?
Traders can wait for a positive reaction from $45-$48, or a move beyond $52, before going long on OKB

- OKB has a bearish daily structure, but it was on the verge of flipping bullishly.
- The quick resurgence and the steady buying pressure over the past week meant a breakout was likely.
OKB [OKB], the exchange token of the crypto exchange OKEx, has made solid gains in recent days. The price was up by almost 35% in the past week, after it had slumped to $38 on the 11th of March.
Bitcoin [BTC] was also up 7% over the past week.
OKB’s relative strength against Bitcoin was highly encouraging. Technical analysis showed there were other encouraging factors for the price action- but swing traders should wait for this key resistance to be broken.
Can OKB bulls achieve a breakout?
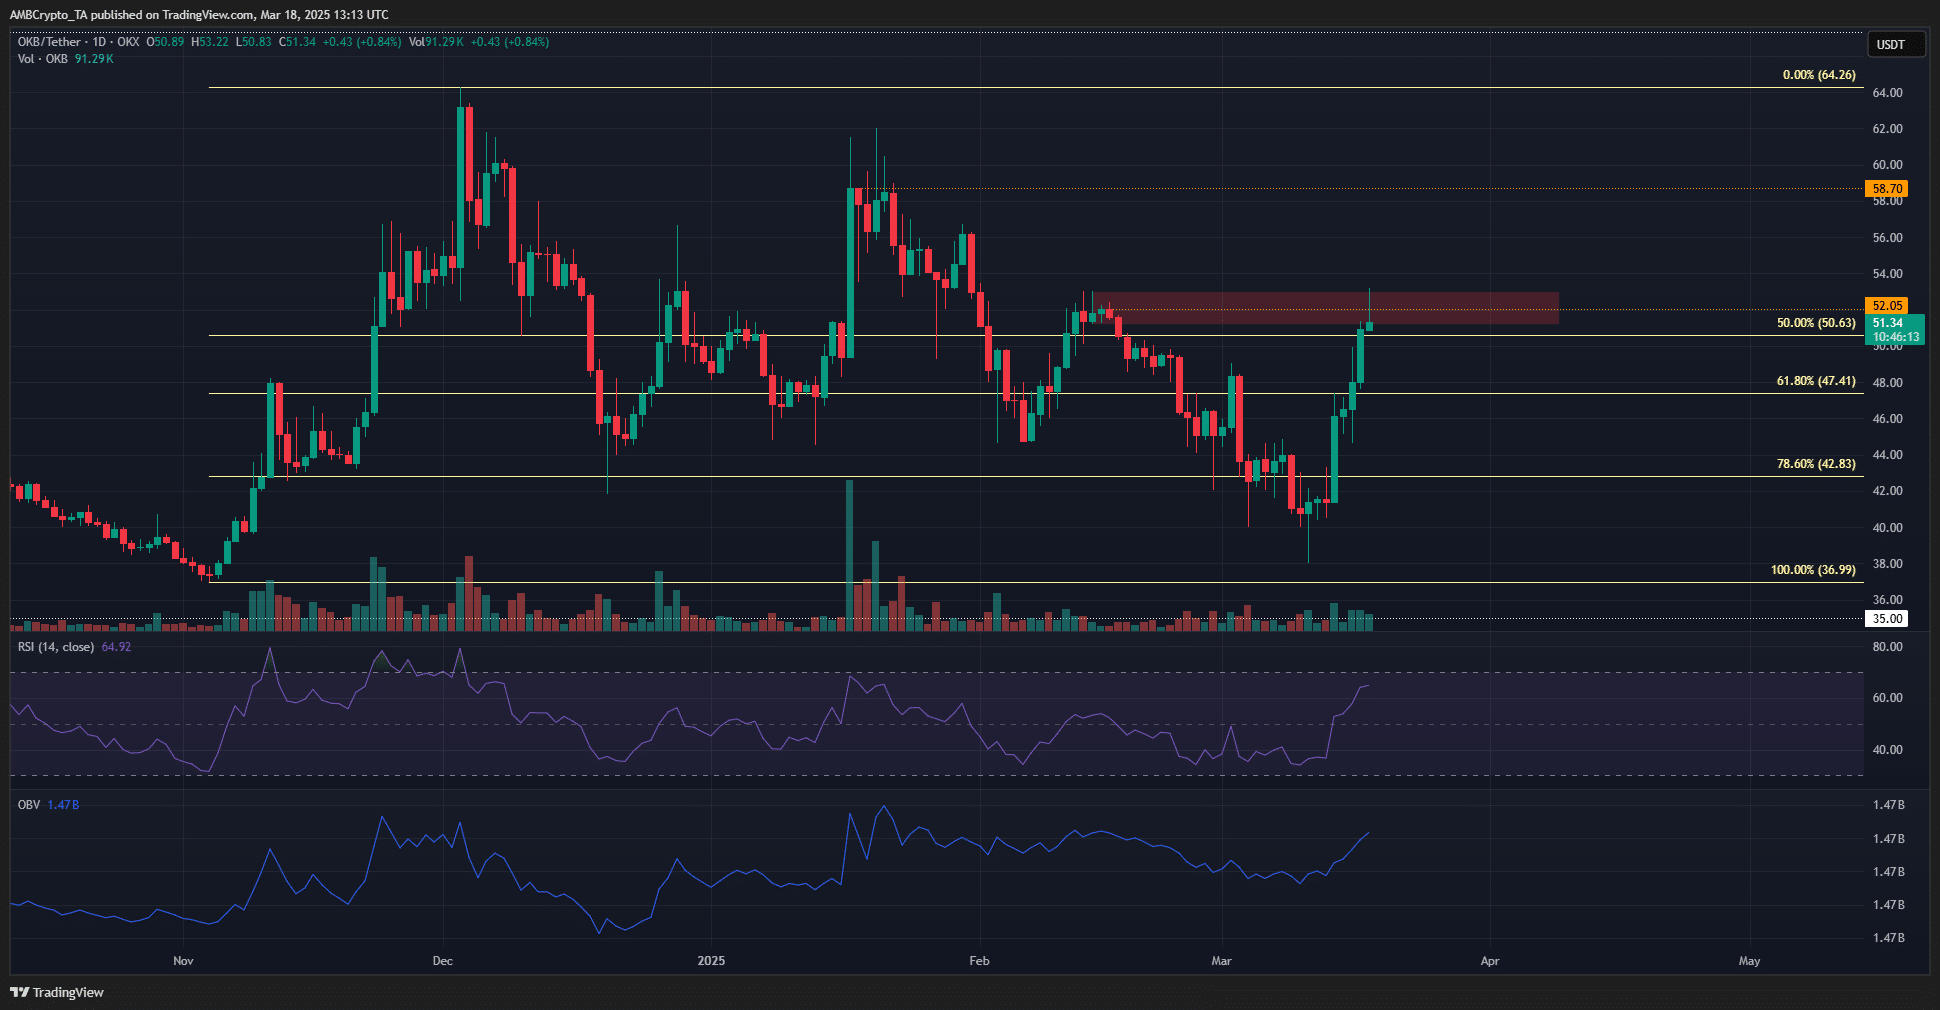
The 1-day chart showed that, although the short-term gains were positive, the structure of the token remained bearish.
To break the market structure bullishly, OKB has to close a daily trading session above the recent lower high at $52.05.
The OKB bulls showed that they had a good chance of achieving this feat. The OBV at press time was near the local highs from February, highlighting strong buying pressure over the past week.
The RSI also broke above neutral 50, underlining a bullish momentum shift.
Another factor that points toward a potential OKB recovery is the swiftness of the move. A week ago, the 78.6% Fibonacci retracement level had been lost.
However, the buyers were able to make a quick comeback and at press time the exchange token was trading above the 50% retracement level.
Swing traders can use a breakout beyond $52 and a subsequent retest to go long, targeting the next local high at $58. However, Bitcoin volatility could throw OKB’s bullishness off balance.
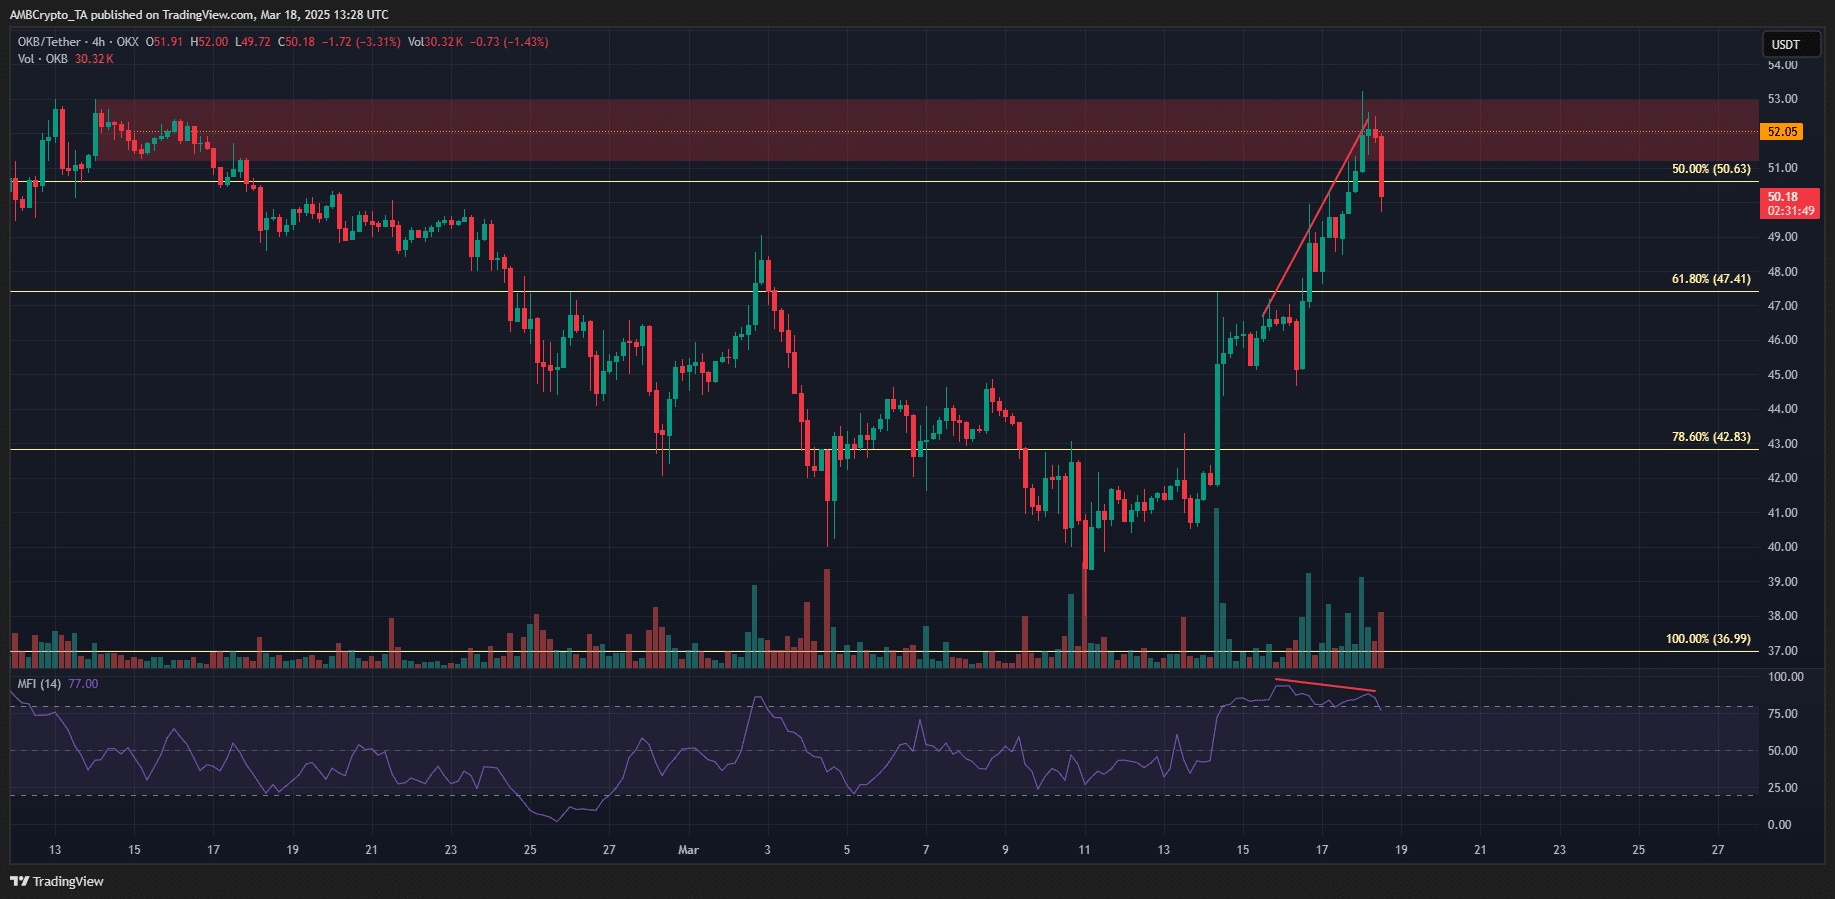
On the 4-hour chart, a bearish divergence between the Money Flow Index and the price presented itself. Highlighted in red, it showed that the price was in retreat during press time.
This could see an OKB retreat to the local support at $48, or even deeper at $45.
Bitcoin fell 0.38% in the hour preceding press time, and OKB was down by 3.17%. While it tied in well with the bearish outlook from the market structure, it went against the other findings.
Hence, traders can wait for a positive reaction from $45-$48, or a move beyond $52, before going long on OKB. The volatility around BTC made this bullish setup fragile.
Disclaimer: The information presented does not constitute financial, investment, trading, or other types of advice and is solely the writer’s opinion