Sei [SEI] is a specialized Layer‑1 blockchain designed to deliver high‑performance infrastructure for decentralized finance (DeFi) applications, focusing on speed, efficiency, and scalability. Officially launched on the 15th of August 2023, Sei enhances digital asset exchange by addressing key limitations in existing blockchain networks.

It focuses on low latency, high throughput, and reliability, making it ideal for decentralized exchanges, derivatives platforms, and trading applications. With the rising demand for efficient blockchain infrastructure, Sei is designed to meet the needs of the high-frequency, data-intensive market.

An important feature Sei brings to the table is its parallel execution model. Instead of blockchains that process transactions one after another, Sei allows multiple transactions to be processed simultaneously. This helps to alleviate network congestion and improve overall network efficiency, especially during peak hours. 

In addition, Sei delivers instant finality, confirming blocks within roughly 300 to 380 milliseconds. This near real‑time speed enhances usability for traders and developers while maintaining decentralization, closely mimicking the experience of centralized platforms.

Sei has also implemented improved compatibility via its growing infrastructure. The new Parallel EVM capability enables developers to deploy Ethereum-enabled applications with the benefit of Sei’s optimized execution environment. This compatibility makes it more accessible for developers and enables current decentralized applications to scale more efficiently.

The ability to optimize performance and ensure developers can easily access the platform solidifies Sei’s relevance in the broader Web3 landscape.

Sei’s tokenomics have clearly emphasized community-centric growth and sustainability in the long term. Currently, about 7.09 billion SEI are in circulation, while the total supply of SEI is capped at 10 billion. The majority of the supply, approximately 51%, has been distributed among the community, further highlighting its commitment to decentralization and ecosystem growth. 

Of these, 48% is directed towards the ecosystem reserves for projects like development grants, strategic partnerships, and staking rewards. The rest of the allocation goes towards the foundation treasury (9%) and launchpool programs (3%), which will help sustain development and user onboarding.

Notably, staking is a core element of Sei’s economic system. As a proof‑of‑stake network, validators play a crucial role in securing the network and verifying transactions. In turn, users can delegate their tokens to validators and earn rewards, which encourages broader participation and strengthens the network.

As of June 2026, the altcoin continues to make steady progress within the Layer‑1 ecosystem as a high‑performance blockchain. The speed, scalability, and its development-friendly tools make it a promising choice for projects demanding efficient execution environments.

As technology evolves and more and more decentralized finance and trading applications are built on top of it, Sei is gradually carving out its niche as the foundational layer for DeFi and trading applications. 


VIEW MORE

Overview

Market Cap
$341.00M
+6.7%
Volume (24H)
$28.46M
Volume (7D)
$180.54M
+1.9%
Max Supply
Circulating Supply
6,733,333,333 SEI
All-Time High
$1.14
-95.6%
All-Time Low
$0.044702
+13.3%
(above ATL)

Prediction Analysis

Current Price
$0.05
Sentiment
Bearish
50-Day SMA
$0.05
Price Prediction
$0.01
-72.00%
Fear & Greed Index
200-Day SMA
$0.07
Green Days
18 / last 30 (62.1%)
Volatility
3.14%
Moderate
14-Day RSI
42.45
Neutral

Profit Calculator

Select asset
%
%
Total Profit
$0
(0%)
Total Exit Amount
$0
Total Investment Fee
$0
Total Exit Fee
$0

Sei Price Prediction

Current Price
$0.05
2031
$0.00
2036
$0.00
2041
$0.00
2046
$0.00

Results are based solely on your predicted price change. They are not indicators of future performance and do not take into account different performance scenarios, historical data, or the effect of fees or other charges.

VIEW MORE

Short-Term Sei Price Targets

Date Prediction Change
Jul 11, 2026 $0.05 -4.85%
Jul 12, 2026 $0.05 -9.47%
Jul 13, 2026 $0.04 -13.87%
Jul 14, 2026 $0.04 -18.05%
Jul 15, 2026 $0.04 -22.03%
Jul 16, 2026 $0.04 -25.81%
Jul 17, 2026 $0.04 -29.41%

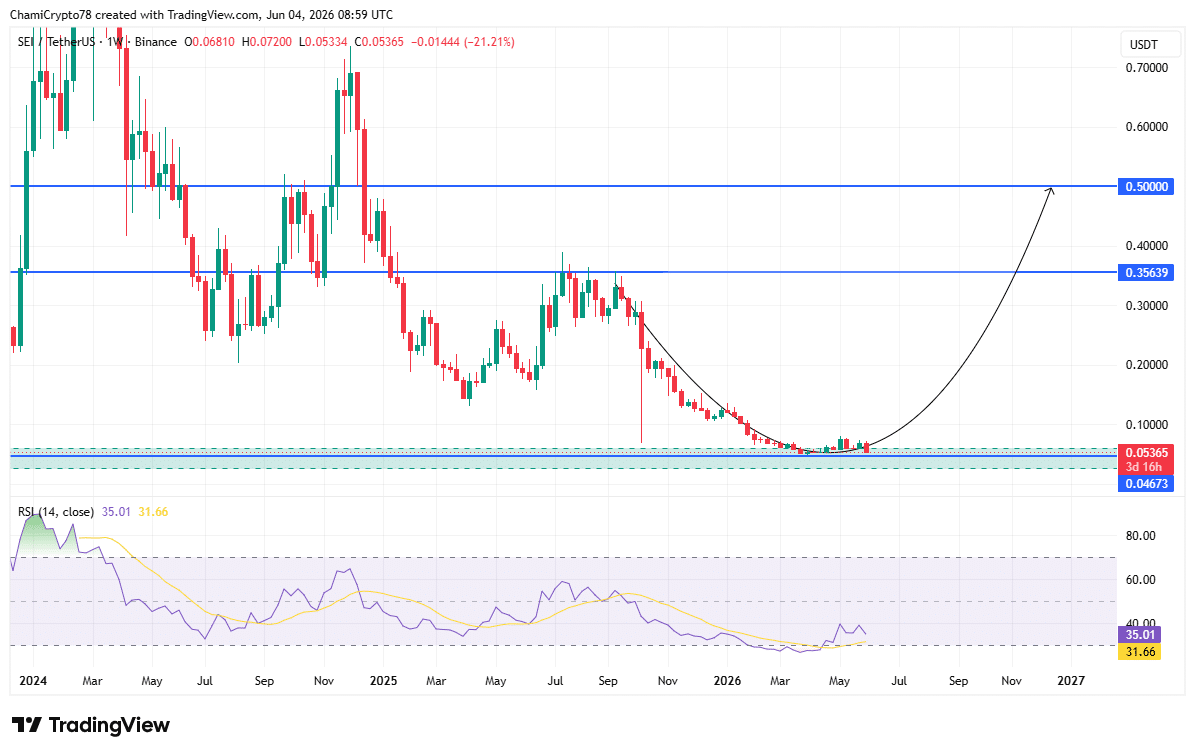
In the short term, SEI is holding above the $0.046 to $0.053 demand zone, which continues to act as a critical support region. Price is attempting to stabilize after an extended decline, with resistance positioned at $0.356. A breakout above this level would strengthen bullish momentum and support a move toward the $0.50 target. At press time, the weekly RSI remained near 35, suggesting that bearish pressure has weakened while leaving room for upward movement. As long as the price remains above the support zone, the structure favors gradual recovery, with accumulation likely continuing before a sustained move higher toward resistance levels.

VIEW MORE

Monthly Sei Price Prediction

Jun 30, 2026
$0.05
Jul 10, 2026
$0.05
Highest in Jul
$0.05
Lowest in Jul
$0.05
Overall Performance
Rising

Long-Term Sei Price Prediction

Month Price AVG Price Max Price Change
Jul $0.05 $0.05 $0.05 -1.27%
Aug $0.04 $0.04 $0.04 -21.02%
Sep $0.04 $0.04 $0.04 -21.02%
Oct $0.03 $0.03 $0.03 -40.76%
Nov $0.03 $0.03 $0.03 -40.76%
Dec $0.03 $0.03 $0.03 -40.76%
In 2026, Sei (SEI) is anticipated to trade between $0 and $0 , leading to an average annualized price of $0 . This could result in a potential return on investment of -27.60% compared to the current price.
VIEW MORE

Historical Price Performance

Year Highest Price Lowest Price
2026 (to date) $0 $0
2025 $0 $0
2024 $1 $0
2023 $1 $0

Since its launch, SEI has experienced significant volatility, initially gaining traction before entering a prolonged correction phase. Throughout 2024 and early 2025, price consistently established lower highs and lower lows, reflecting sustained bearish pressure across the broader market. This downtrend gradually slowed as price approached the current demand zone, where accumulation began to emerge. Recent price action indicates that selling pressure has weakened, with stabilization occurring near key support levels. The formation of a rounding bottom indicates a potential shift toward accumulation, signaling early stages of recovery as market participants begin to re-enter positions.

VIEW MORE

Technical Analysis

On the weekly timeframe, SEI is consolidating within a well‑defined demand zone between $0.046 and $0.053. This zone has repeatedly acted as a strong support base following an extended downtrend. Moreover, it reflects sustained accumulation, where selling pressure has eased and buyers are gradually regaining control. 

Source: TradingView

Price is attempting to stabilize above this range, with the first key resistance positioned at $0.356, a level that previously acted as a rejection point. A successful reclaim of this resistance would strengthen bullish continuation toward the $0.50 target.

At press time, the weekly RSI remained around 35, indicating that the asset is still near oversold territory, suggesting weakening bearish momentum and potential for recovery as demand builds.

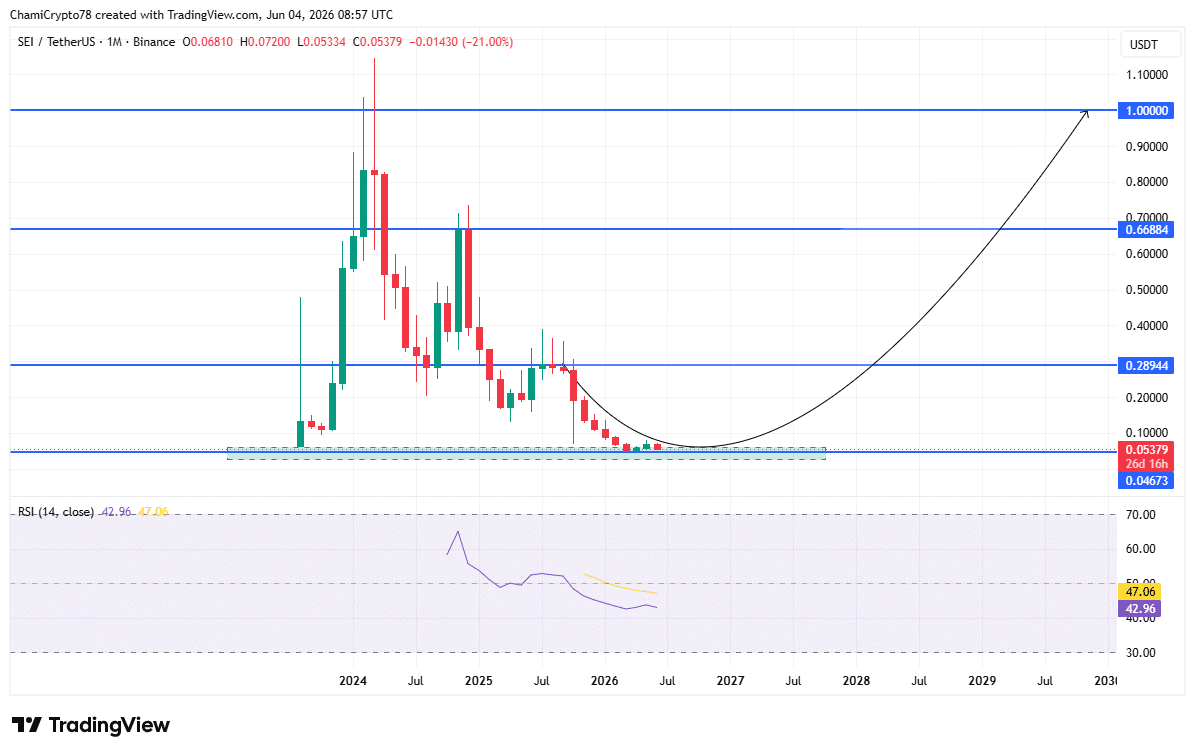
On the monthly timeframe, SEI is forming a broader rounding bottom structure, signaling a potential macro transition from bearish conditions into a long-term accumulation phase. This structure reflects a gradual shift in sentiment as buyers begin to absorb supply over time. 

Source: TradingView

Key resistance levels are defined at $0.289, $0.668, and ultimately $1.00, which aligns with the long-term projection. At the time of writing, the monthly RSI remained below 50, confirming that the asset is still in early recovery stages, with room for expansion if momentum strengthens.

Guides

How to Read Sei Charts and Predict Price Movements?

Most traders use candlestick charts, as they provide more information than a simple line chart. Traders can view candlesticks that represent the price action of Sei with different granularity – for example, you could choose a 5-minute candlestick chart for extremely short-term price action or choose a weekly candlestick chart to identify long-term trends. 1-hour, 4-hour, and 1-day candlestick charts are among the most popular.

Let’s use a 1-hour candlestick chart as an example of how this type of price chart gives us information about opening and closing prices. The chart is divided into “candles” that give us information about Sei’s price action in 1-hour chunks. Each candlestick will display the asset’s opening price, closing price, as well as the highest and lowest prices reached within that period.

Sei Price Prediction Indicators

Moving averages are among the most popular Sei price prediction tools. As the name suggests, a moving average provides the average closing price over a selected time frame, which is divided into a number of periods of the same length. For example, a 12-day simple moving average is calculated by summing the closing prices over the last 12 days and dividing the result by 12.

In addition to the simple moving average (SMA), traders also use another type of moving average called the exponential moving average (EMA). The EMA gives more weight to recent prices, and therefore reacts more quickly to changes in market conditions.

What Affects the Price of Sei?

Just like with any other asset, the price action of Sei is driven by supply and demand. These dynamics can be influenced by fundamental events such as block reward halvings, hard forks, or new protocol updates. Regulations, adoption by companies and governments, cryptocurrency exchange hacks, and other real-world events can also affect market sentiment.

Technical indicators such as moving averages, RSI, and trading volume are also used by traders to anticipate price movements and identify potential trend reversals.

FAQs on Sei Price Predictions

As of today, Sei (SEI) is trading at $0.050643. The current market sentiment is Bearish, with RSI at 42.45 (Neutral) and volatility classified as Moderate.
Based on our technical analysis and projected annual growth rate, Sei could reach $0.01418 by 2027. This estimate assumes continued market momentum and adoption trends.
According to our technical analysis indicators, the Sei price prediction is forecasted to reach $0.000087 within the next five years (by 2031). Over the last 30 days, Sei recorded green days 62% of the time.
Based on multiple technical indicators, the current outlook for Sei in 2026 is Bearish. RSI currently sits at 42.45, which indicates Neutral momentum. However, investors should evaluate both technical signals and fundamental developments before making any investment decisions.
Long-term forecasts indicate that Sei may continue to grow over the next decade if adoption, technology development, and global crypto demand continue to expand.
While Sei's future value depends on various factors, technical indicators suggest it could experience both bullish and bearish cycles over time. Long-term investors typically monitor RSI levels, moving averages, and broader market sentiment when evaluating SEI's future trajectory.
Disclaimer

AMBCrypto's content is meant to be informational in nature and should not be interpreted as investment advice. Trading, buying or selling cryptocurrencies should be considered a high-risk investment and every reader is advised to do their own research before making any decisions.