OP is the native token of Optimism, a Layer 2 (L2) network built on Ethereum. Optimism was developed by OP Labs, formerly known as Plasma Group, which was founded by former Ethereum developers in 2019 in New York. The project’s co-founders include Jinglan Wang (CEO), Karl Floersch, Benjamin Jones, and Kevin Ho.

Optimism’s biggest innovation is the OP Stack and the Superchain. Together, they reduce transaction costs, improve scalability, and allow developers to build customized, interoperable blockchains on Ethereum. Coinbase’s Base chain is one of the best-known examples built using the OP Stack.

Beyond scaling Ethereum, the OP ecosystem also supports Retroactive Public Goods Funding (RetroPGF). This governance initiative directs ecosystem revenue toward developers, researchers, and creators contributing to public goods.

According to CoinMarketCap, OP has a maximum supply of 4.29 billion tokens, while about 2.15 billion were circulating at the time of writing. The token follows a gradual vesting schedule, with major unlocks expected to conclude during 2026.

The circulating supply is spread across more than 1.37 million holders, while the Fully Diluted Value (FDV) stood above $437 million.

The initial allocation included 25% to the ecosystem fund, covering governance reserves, partner funds, and seed allocations, 20% to RetroPGF, 19% to user airdrops, 19% to core contributors, and 17% to investors. To strengthen long-term demand, governance later approved using 50% of Superchain sequencer revenue for monthly OP buybacks.

Before launching its token, Optimism completed four funding rounds.

The Seed round raised roughly $3.5 million in 2020, backed by IDEO CoLab and Fred Ehrsam. Series A followed in February 2021, raising $25 million, while Series B secured $150 million in March 2022. Another undisclosed funding round took place in November 2022 after the OP token began trading.

Major investors included Andreessen Horowitz (a16z), Paradigm, Cynegetic Investment Management, and Nascent.

Following its transition from Plasma Group to Optimism Company, development accelerated.

The experimental optimistic rollup launched in 2020. Cannon fault proofs arrived in March 2022, while the OP Stack launched later that year.

Optimism introduced its Superchain vision in February 2023. The Bedrock upgrade followed in June, reducing transaction costs and improving network performance. Coinbase later launched Base on the OP Stack in August 2023.

Throughout 2024 and 2025, the ecosystem expanded as more projects adopted the Superchain framework.

In 2026, OP Labs introduced a buyback program that directed 50% of monthly sequencer revenue toward purchasing OP tokens. The company also introduced OP Enterprise, an enterprise deployment solution.

Looking ahead, Optimism has outlined plans around post-quantum cryptography and Account Abstraction. These initiatives aim to improve wallet security while supporting broader adoption of EIP-7702 across the Superchain.

Like many blockchain ecosystems, Optimism has experienced security incidents.

In February 2022, developers discovered the “Unbridled Optimism” bug, which could have allowed attackers to mint unlimited ETH. The issue was patched before widespread exploitation, and the team awarded a record $2 million bug bounty.

Later that year, Wintermute lost about 20 million OP tokens after an operational mistake during an over-the-counter liquidity transaction. The attacker eventually returned roughly 90% of the stolen funds.

The broader Optimism ecosystem also experienced several third-party exploits.

Hundred Finance lost around $7.4 million in April 2023. Exactly Protocol suffered a $7.3 million exploit in August 2023, while Sonne Finance lost approximately $20 million in May 2024.

During 2024, Optimism also introduced upgrades such as Granite to strengthen its fault-proof system and improve network security.

VIEW MORE

Overview

Market Cap
$219.14M
-2.6%
Volume (24H)
$36.59M
Volume (7D)
$248.78M
-7.6%
Max Supply
4,294,967,296 OP
Circulating Supply
2,281,750,034 OP
All-Time High
$4.84
-98.0%
All-Time Low
$0.088878
+8.0%
(above ATL)

Prediction Analysis

Current Price
$0.10
Sentiment
Bearish
50-Day SMA
$0.10
Price Prediction
$0.02
-81.50%
Fear & Greed Index
200-Day SMA
$0.15
Green Days
16 / last 30 (55.2%)
Volatility
2.90%
Moderate
14-Day RSI
31.26
Neutral

Profit Calculator

Select asset
%
%
Total Profit
$0
(0%)
Total Exit Amount
$0
Total Investment Fee
$0
Total Exit Fee
$0

Optimism Price Prediction

Current Price
$0.10
2031
$0.00
2036
$0.00
2041
$0.00
2046
$0.00

Results are based solely on your predicted price change. They are not indicators of future performance and do not take into account different performance scenarios, historical data, or the effect of fees or other charges.

VIEW MORE

Short-Term Optimism Price Targets

Date Prediction Change
Jul 19, 2026 $0.09 -3.43%
Jul 20, 2026 $0.09 -6.74%
Jul 21, 2026 $0.09 -9.94%
Jul 22, 2026 $0.08 -13.03%
Jul 23, 2026 $0.08 -16.02%
Jul 24, 2026 $0.08 -18.90%
Jul 25, 2026 $0.08 -21.68%

The short-term outlook improves if OP reclaims the $0.50 level as support. Holding above that level could allow the token to revisit $1 before attempting a move toward $2, where OP initially traded after launch. The improving MACD supports this possibility. Even so, buyers still need stronger momentum to break the ongoing consolidation. If OP remains below $0.50, the token could continue consolidating or revisit lower price levels.

VIEW MORE

Monthly Optimism Price Prediction

Jun 30, 2026
$0.10
Jul 17, 2026
$0.10
Highest in Jul
$0.11
Lowest in Jul
$0.09
Overall Performance
Rising

Long-Term Optimism Price Prediction

Month Price AVG Price Max Price Change
Jul $0.08 $0.09 $0.09 -16.71%
Aug $0.07 $0.08 $0.08 -27.12%
Sep $0.06 $0.06 $0.06 -37.53%
Oct $0.05 $0.06 $0.06 -47.94%
Nov $0.04 $0.05 $0.05 -58.35%
Dec $0.04 $0.04 $0.04 -58.35%
The larger bullish outlook depends on OP reclaiming the $2 region. If that happens, higher targets around $3 and the all-time high of $4.866 become possible. Before reaching those levels, OP would first need to overcome resistance near $0.50, $1, and $1.80. Failing to clear those levels could keep the token trading sideways or extend the broader downtrend.
VIEW MORE

Historical Price Performance

Year Highest Price Lowest Price
2026 (to date) $0 $0
2025 $2 $0
2024 $5 $1
2023 $4 $1
2022 $2 $0

Historically, OP has traded between an all-time high of $4.866 and an all-time low near $0.09. Large token unlocks have repeatedly increased supply and created selling pressure. Broader weakness across the altcoin market has also weighed on price. On the bullish side, the Superchain buyback program, ecosystem growth, DeFi adoption, and continued Layer 2 expansion have periodically supported OP's recovery.

VIEW MORE

Technical Analysis

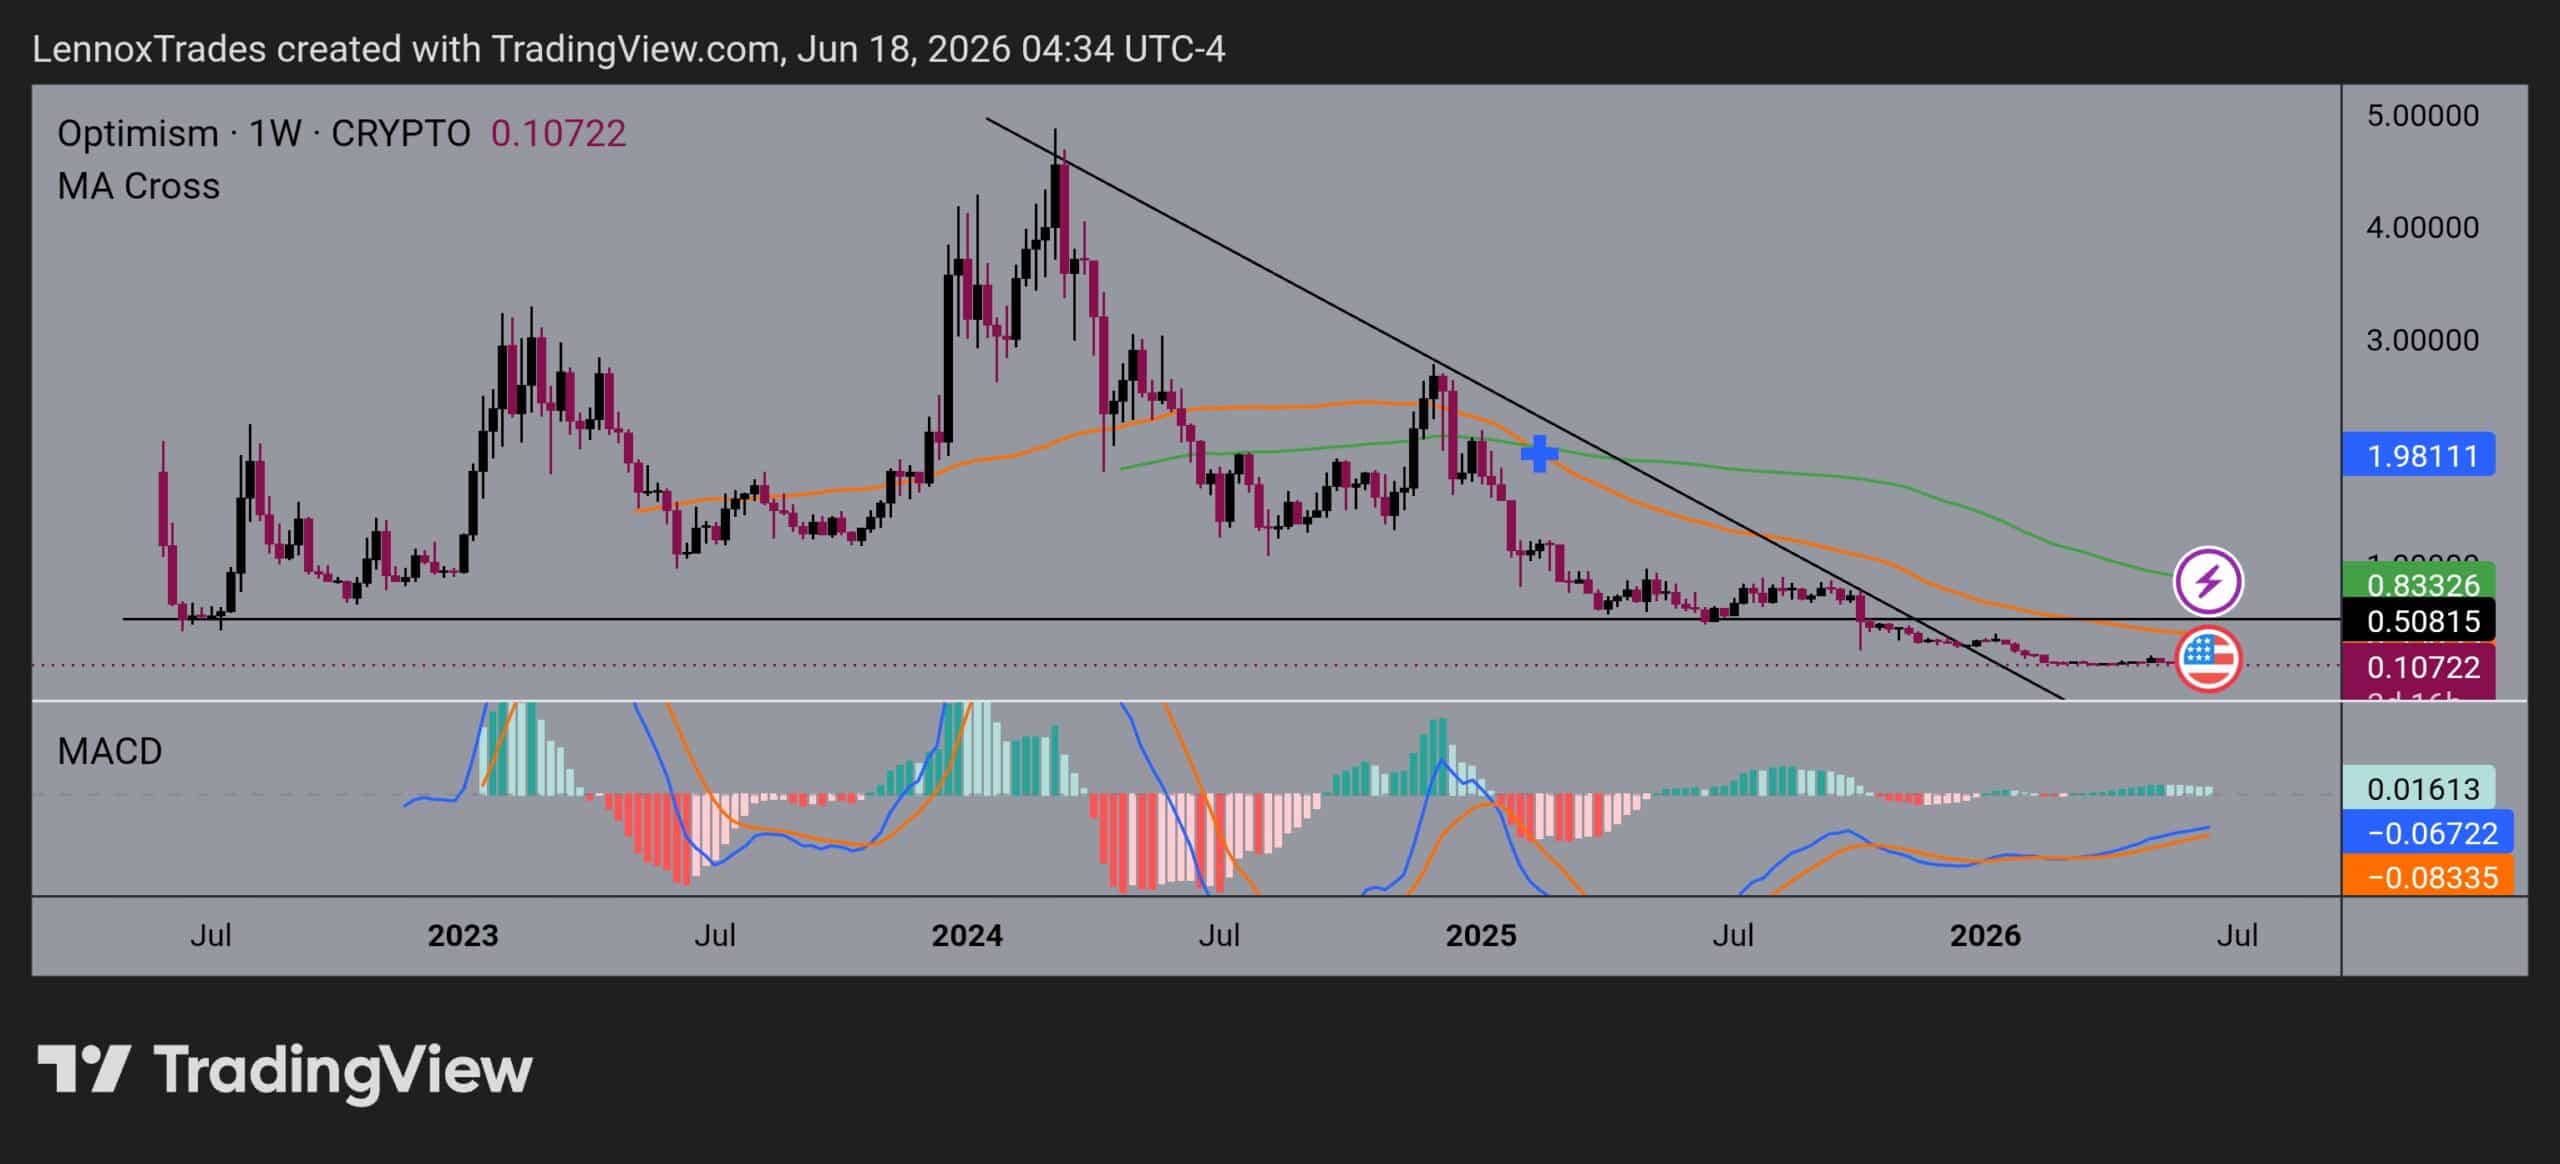
Optimism started trading in June 2022. After launch, OP dropped to around $0.51 before establishing its first major bottom.

The token later recovered above its initial trading range before correcting more than 95%.

A longer-term bottom eventually formed through a head-and-shoulders pattern, with the head near $0.65 and both shoulders around $0.85. OP then rallied to about $3.28 in February 2024 before retracing toward the 50-week moving average.

Source: OP/USD weekly price chart

A successful reclaim of the 50-week moving average later pushed OP to its all-time high of $4.866.

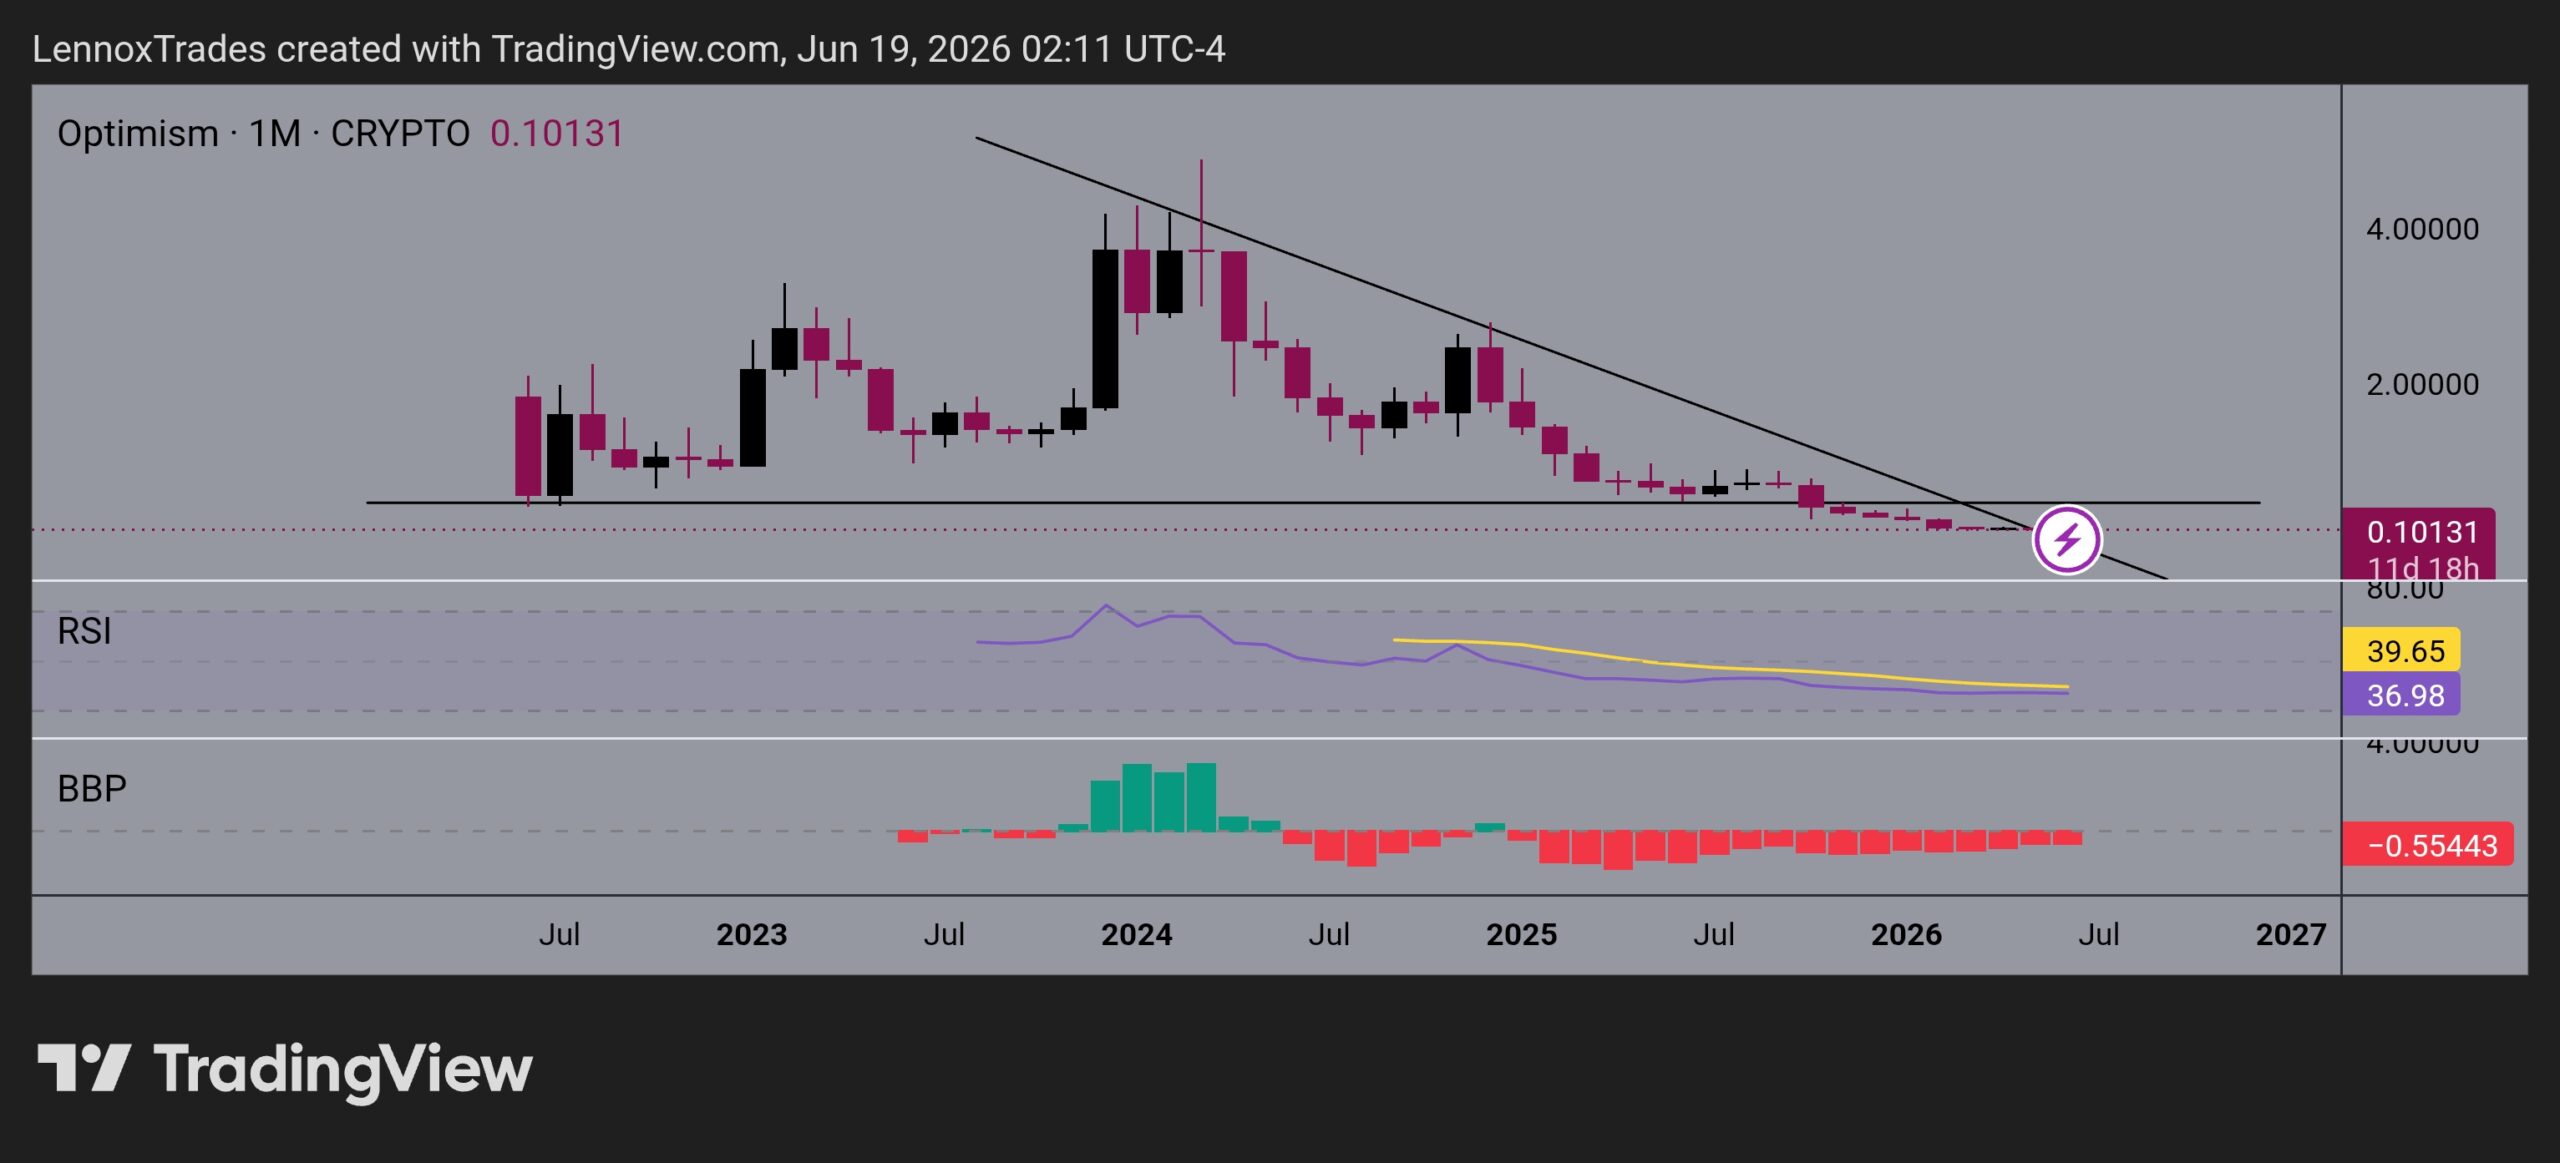
Since then, the token has remained in a broader downtrend, although price has largely moved sideways throughout 2026.

The descending trendline broke during late April 2026. At the same time, the MACD histogram turned positive, suggesting bullish momentum was gradually improving.

However, momentum remained mixed.

The monthly RSI stood near 36, indicating bearish momentum still dominated. Bull Bear Power also remained below zero, although weakening bearish pressure suggested selling momentum had started to fade.

Source: OP/USD monthly price chart on TradingView

OP continues trading below both its 50-week and 100-week moving averages, keeping the broader trend bearish despite early signs of stabilization.


Guides

How to Read Optimism Charts and Predict Price Movements?

Most traders use candlestick charts, as they provide more information than a simple line chart. Traders can view candlesticks that represent the price action of Optimism with different granularity – for example, you could choose a 5-minute candlestick chart for extremely short-term price action or choose a weekly candlestick chart to identify long-term trends. 1-hour, 4-hour, and 1-day candlestick charts are among the most popular.

Let’s use a 1-hour candlestick chart as an example of how this type of price chart gives us information about opening and closing prices. The chart is divided into “candles” that give us information about Optimism’s price action in 1-hour chunks. Each candlestick will display the asset’s opening price, closing price, as well as the highest and lowest prices reached within that period.

Optimism Price Prediction Indicators

Moving averages are among the most popular Optimism price prediction tools. As the name suggests, a moving average provides the average closing price over a selected time frame, which is divided into a number of periods of the same length. For example, a 12-day simple moving average is calculated by summing the closing prices over the last 12 days and dividing the result by 12.

In addition to the simple moving average (SMA), traders also use another type of moving average called the exponential moving average (EMA). The EMA gives more weight to recent prices, and therefore reacts more quickly to changes in market conditions.

What Affects the Price of Optimism?

Just like with any other asset, the price action of Optimism is driven by supply and demand. These dynamics can be influenced by fundamental events such as block reward halvings, hard forks, or new protocol updates. Regulations, adoption by companies and governments, cryptocurrency exchange hacks, and other real-world events can also affect market sentiment.

Technical indicators such as moving averages, RSI, and trading volume are also used by traders to anticipate price movements and identify potential trend reversals.

FAQs on Optimism Price Predictions

As of today, Optimism (OP) is trading at $0.096048. The current market sentiment is Bearish, with RSI at 31.26 (Neutral) and volatility classified as Moderate.
Based on our technical analysis and projected annual growth rate, Optimism could reach $0.017769 by 2027. This estimate assumes continued market momentum and adoption trends.
According to our technical analysis indicators, the Optimism price prediction is forecasted to reach $0.000021 within the next five years (by 2031). Over the last 30 days, Optimism recorded green days 55% of the time.
Based on multiple technical indicators, the current outlook for Optimism in 2026 is Bearish. RSI currently sits at 31.26, which indicates Neutral momentum. However, investors should evaluate both technical signals and fundamental developments before making any investment decisions.
Long-term forecasts indicate that Optimism may continue to grow over the next decade if adoption, technology development, and global crypto demand continue to expand.
While Optimism's future value depends on various factors, technical indicators suggest it could experience both bullish and bearish cycles over time. Long-term investors typically monitor RSI levels, moving averages, and broader market sentiment when evaluating OP's future trajectory.
Disclaimer

AMBCrypto's content is meant to be informational in nature and should not be interpreted as investment advice. Trading, buying or selling cryptocurrencies should be considered a high-risk investment and every reader is advised to do their own research before making any decisions.