Monero’s inorganic rally faces rejection at $400 – What’s next for traders now?
Since February, the privacy token has traded around the $352-key level for the most part.

On Thursday, 11 June, Monero [XMR] rallied by 16.6%, following the 13.3% gains made in the preceding three days. The bounce hit $390 on Thursday.
On Friday, intraday trading saw XMR reach a local high of $426, before pulling back to close the day at $353. This downward momentum persisted though, and at the time of writing, the privacy token was trading at $347 on the charts.
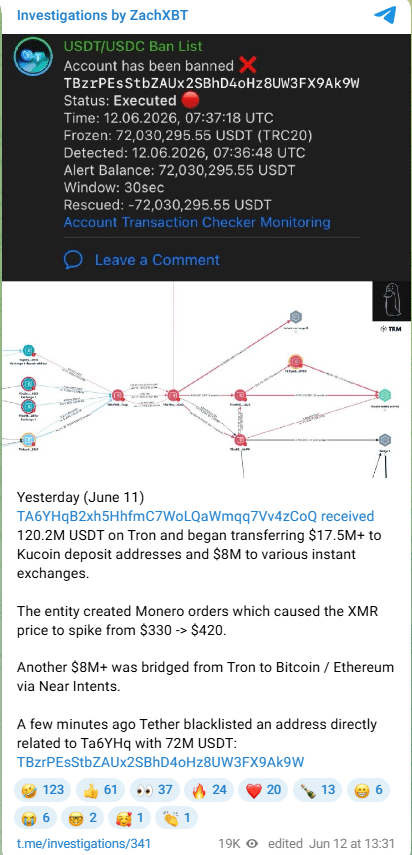
Thursday’s price spike came as a result of an entity creating Monero orders following a $120.2 million USDT deposit to a TRON [TRX] address. The entity was splitting up the deposit and also used Monero to hide these funds.
The large orders that came were enough to substantially move the market.
The swift gains in recent days were not part of a lasting trend. Combining the higher and lower timeframe price structures of Monero gave a mixed result, but the bears seemed to have the advantage overall.
Internal XMR bearish structure re-established?
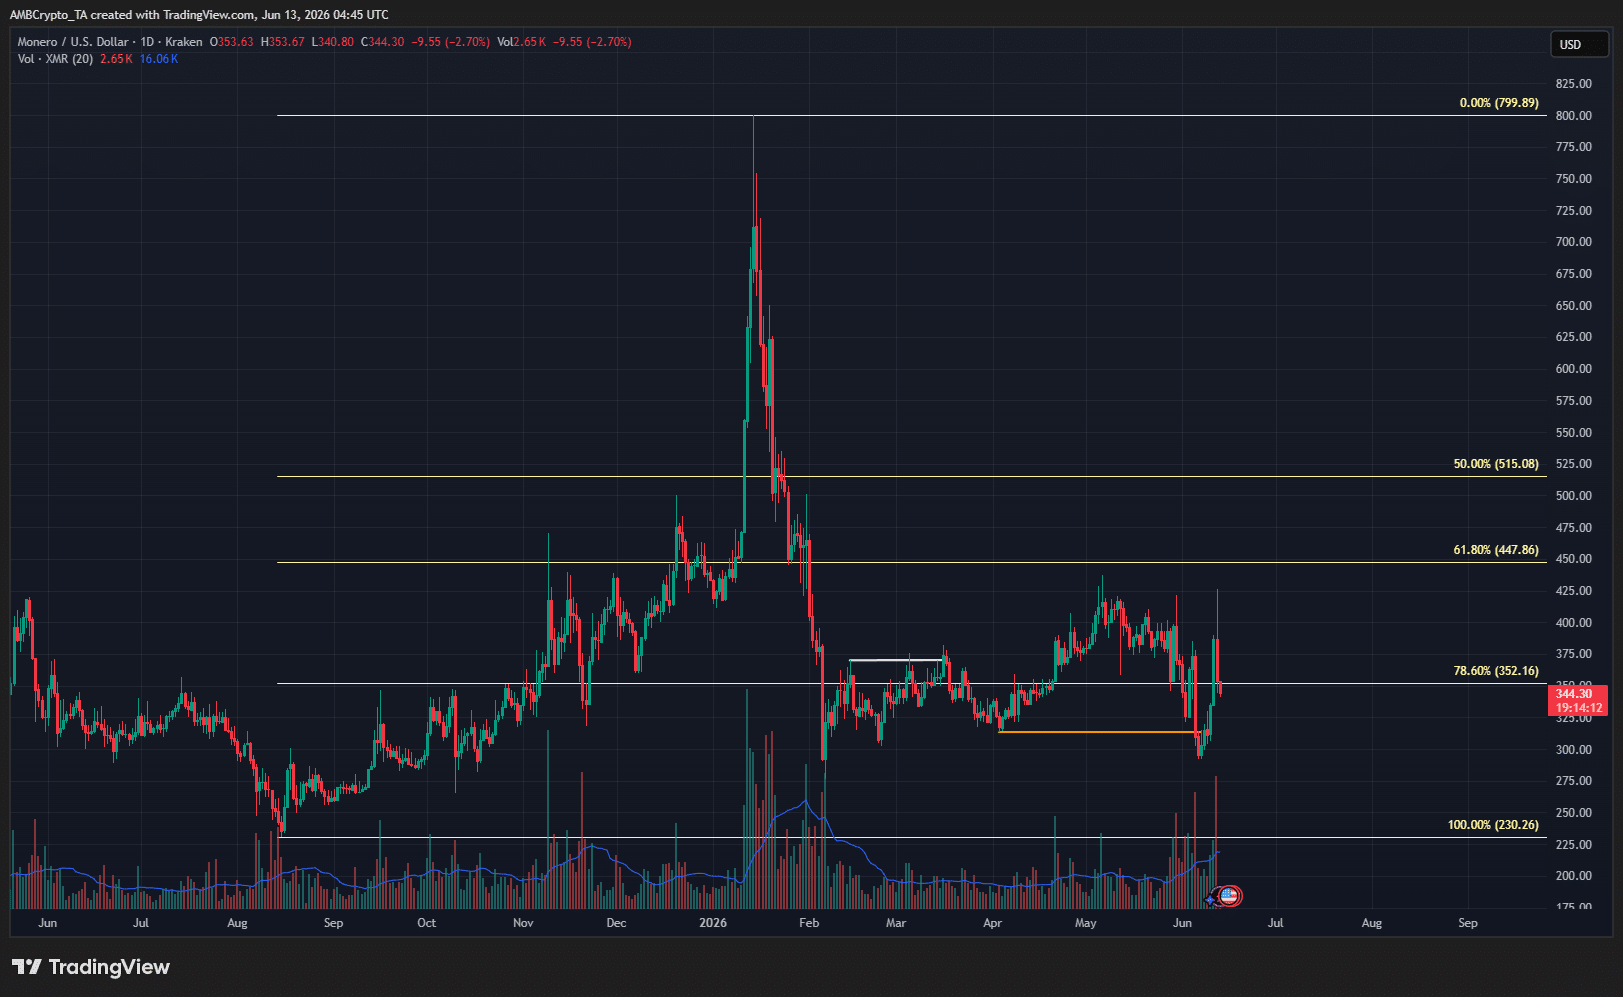
On the 1-day chart, the swing structure was bullish, captured by the swing move higher from $230.2 to $800. And yet, this rally has since seen a deep retracement, even below the 78.6% Fibonacci retracement level at $352.
Since February, the privacy token has traded around this key level for the most part.
Examining the internal structure, the latest shift (orange) was a bearish one. This indicated that the latest market rally was just a retracement of a lower timeframe downtrend.
It also implied that traders should expect further losses.
Traders’ call to action – Stay bearish
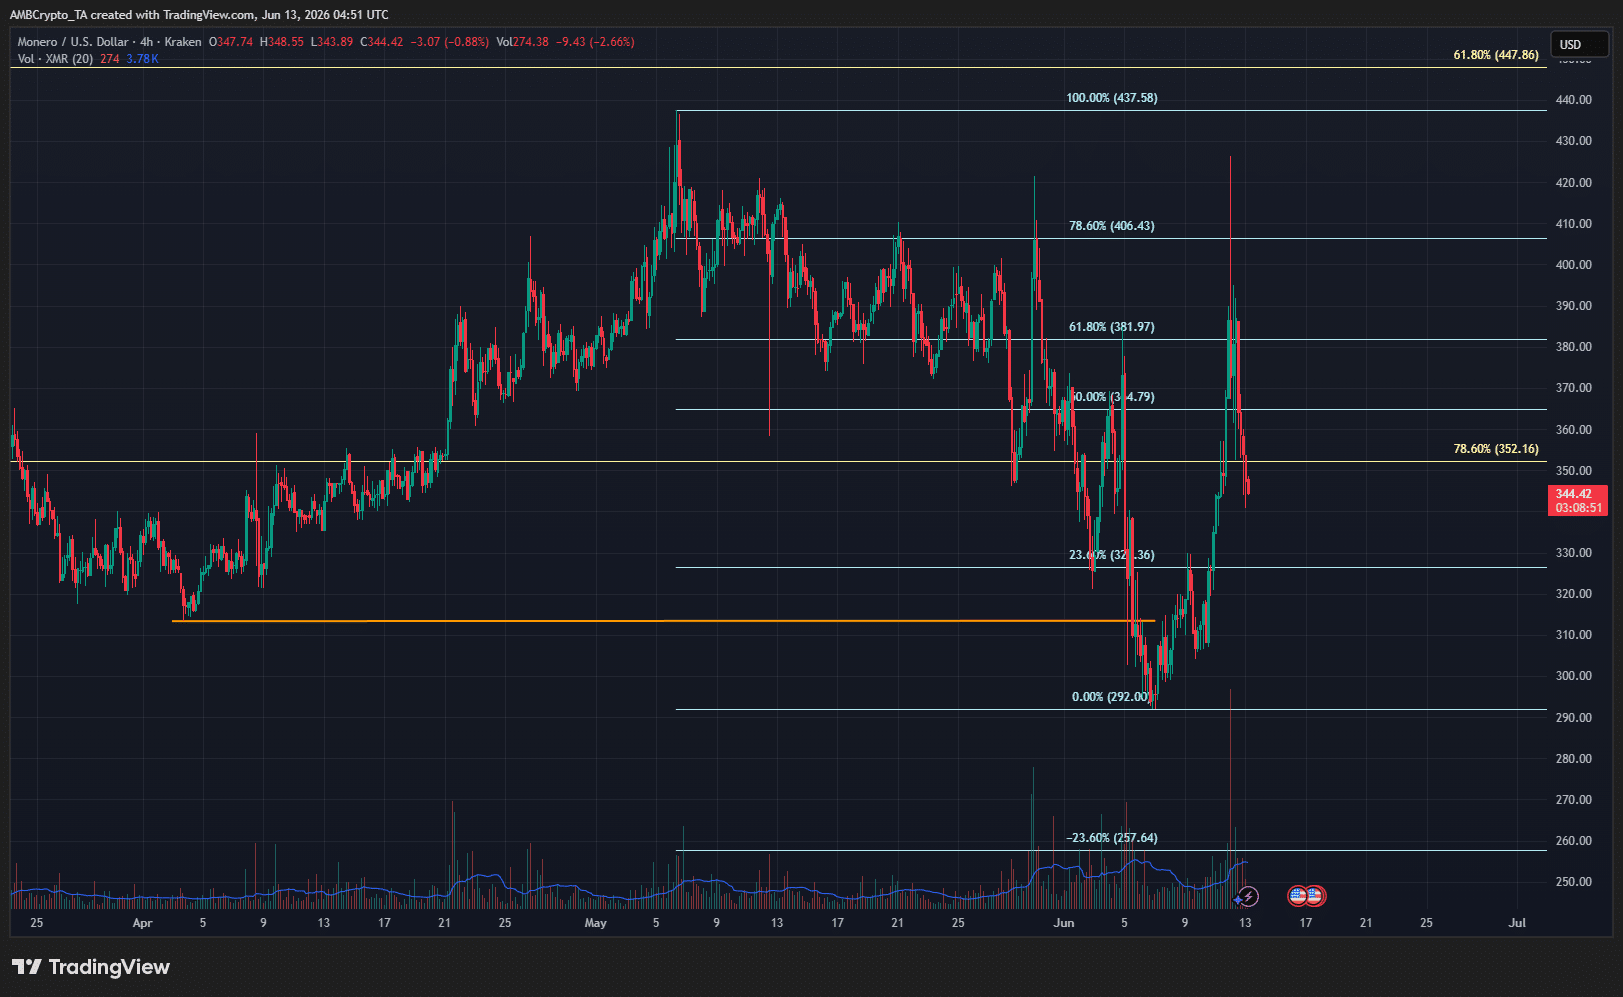
The H4 swing structure break and subsequent relief rally reached $426, just beyond the $406 Fibonacci retracement level (cyan). The higher timeframe structure’s internal bearish shift seemed to be a bearish trend on the 4-hour chart.
Therefore, in the coming days, a price drop to the $292 local support and $252 southward extension can be anticipated. A rally beyond $437 is needed to flip this timeframe’s swing structure bullishly.
Final Summary
- Recent price spike came as a result of large Monero orders made to move funds linked to an exploit address, causing a 16.6% intraday price move.
- Short-term trend has remained firmly bearish, and a drop below the $300-psychological level can be expected.