Fidelity’s FBTC flips to $15.5M inflows – But THESE 2 indicators favor bears
Bitcoin received fresh capital, yet sellers retained the directional edge.



U.S. Spot Bitcoin ETFs recorded renewed demand after weeks of inconsistent flows, but Bitcoin’s market structure remained fragile.
Fidelity’s fund finally returned to inflows. However, exchange activity and derivatives momentum still favored sellers.
Is Fidelity demand returning?
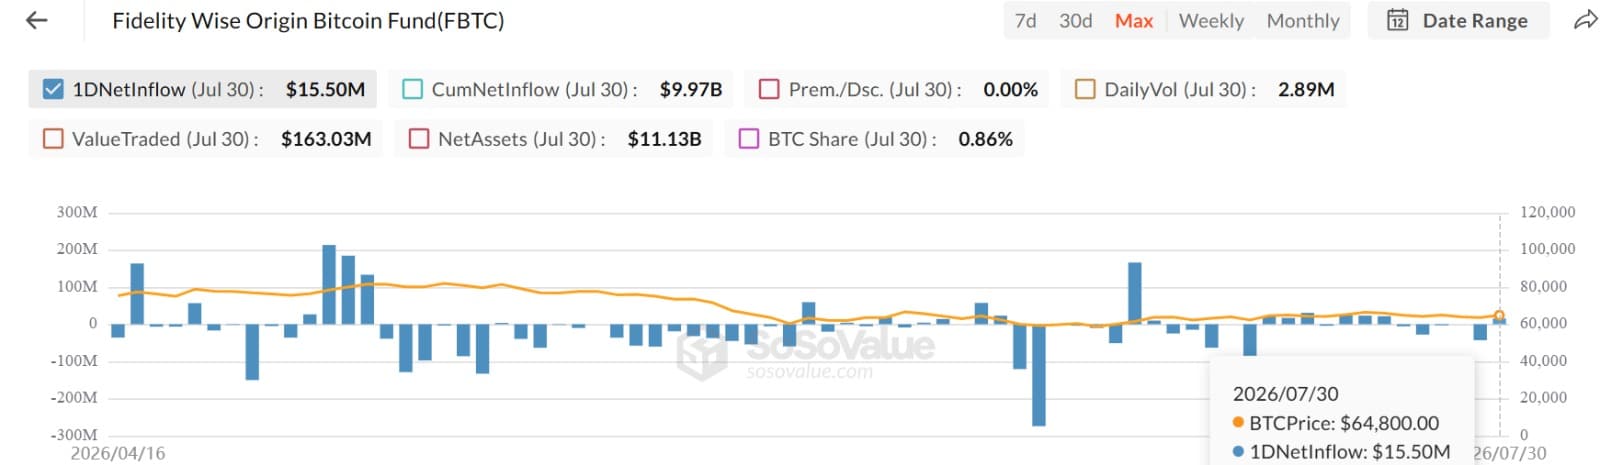
Fidelity Wise Origin Bitcoin Fund (FBTC) recorded $15.5 million in Daily Net Inflows as July ended. The reading reversed the previous day’s $43 million outflow. It also ended FBTC’s recent run of mostly negative flows.
Seven other Spot Bitcoin ETFs recorded inflows during the same session. Consequently, Daily Total Net Inflow reached $233 million, its highest level in three weeks.
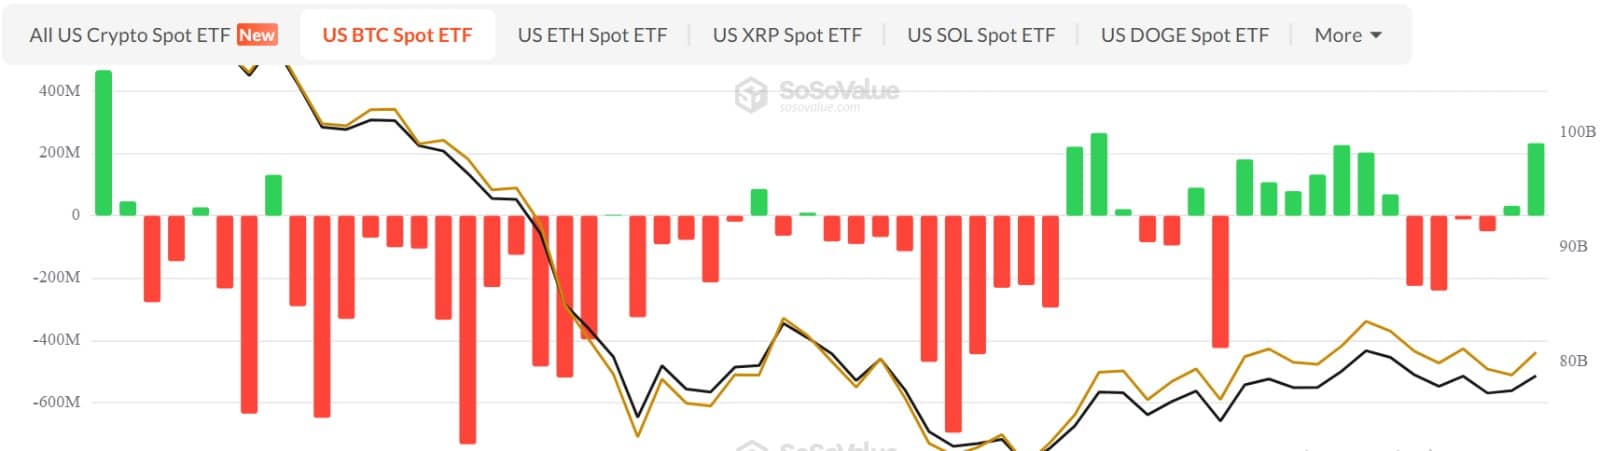
The reversal showed that institutional demand improved during the session. However, one positive day cannot confirm a sustained shift.
Historically, prolonged ETF inflows have supported Bitcoin [BTC] by increasing steady Spot demand.
Are U.S. buyers still cautious?
Despite the ETF recovery, the Coinbase Premium Index remained negative.
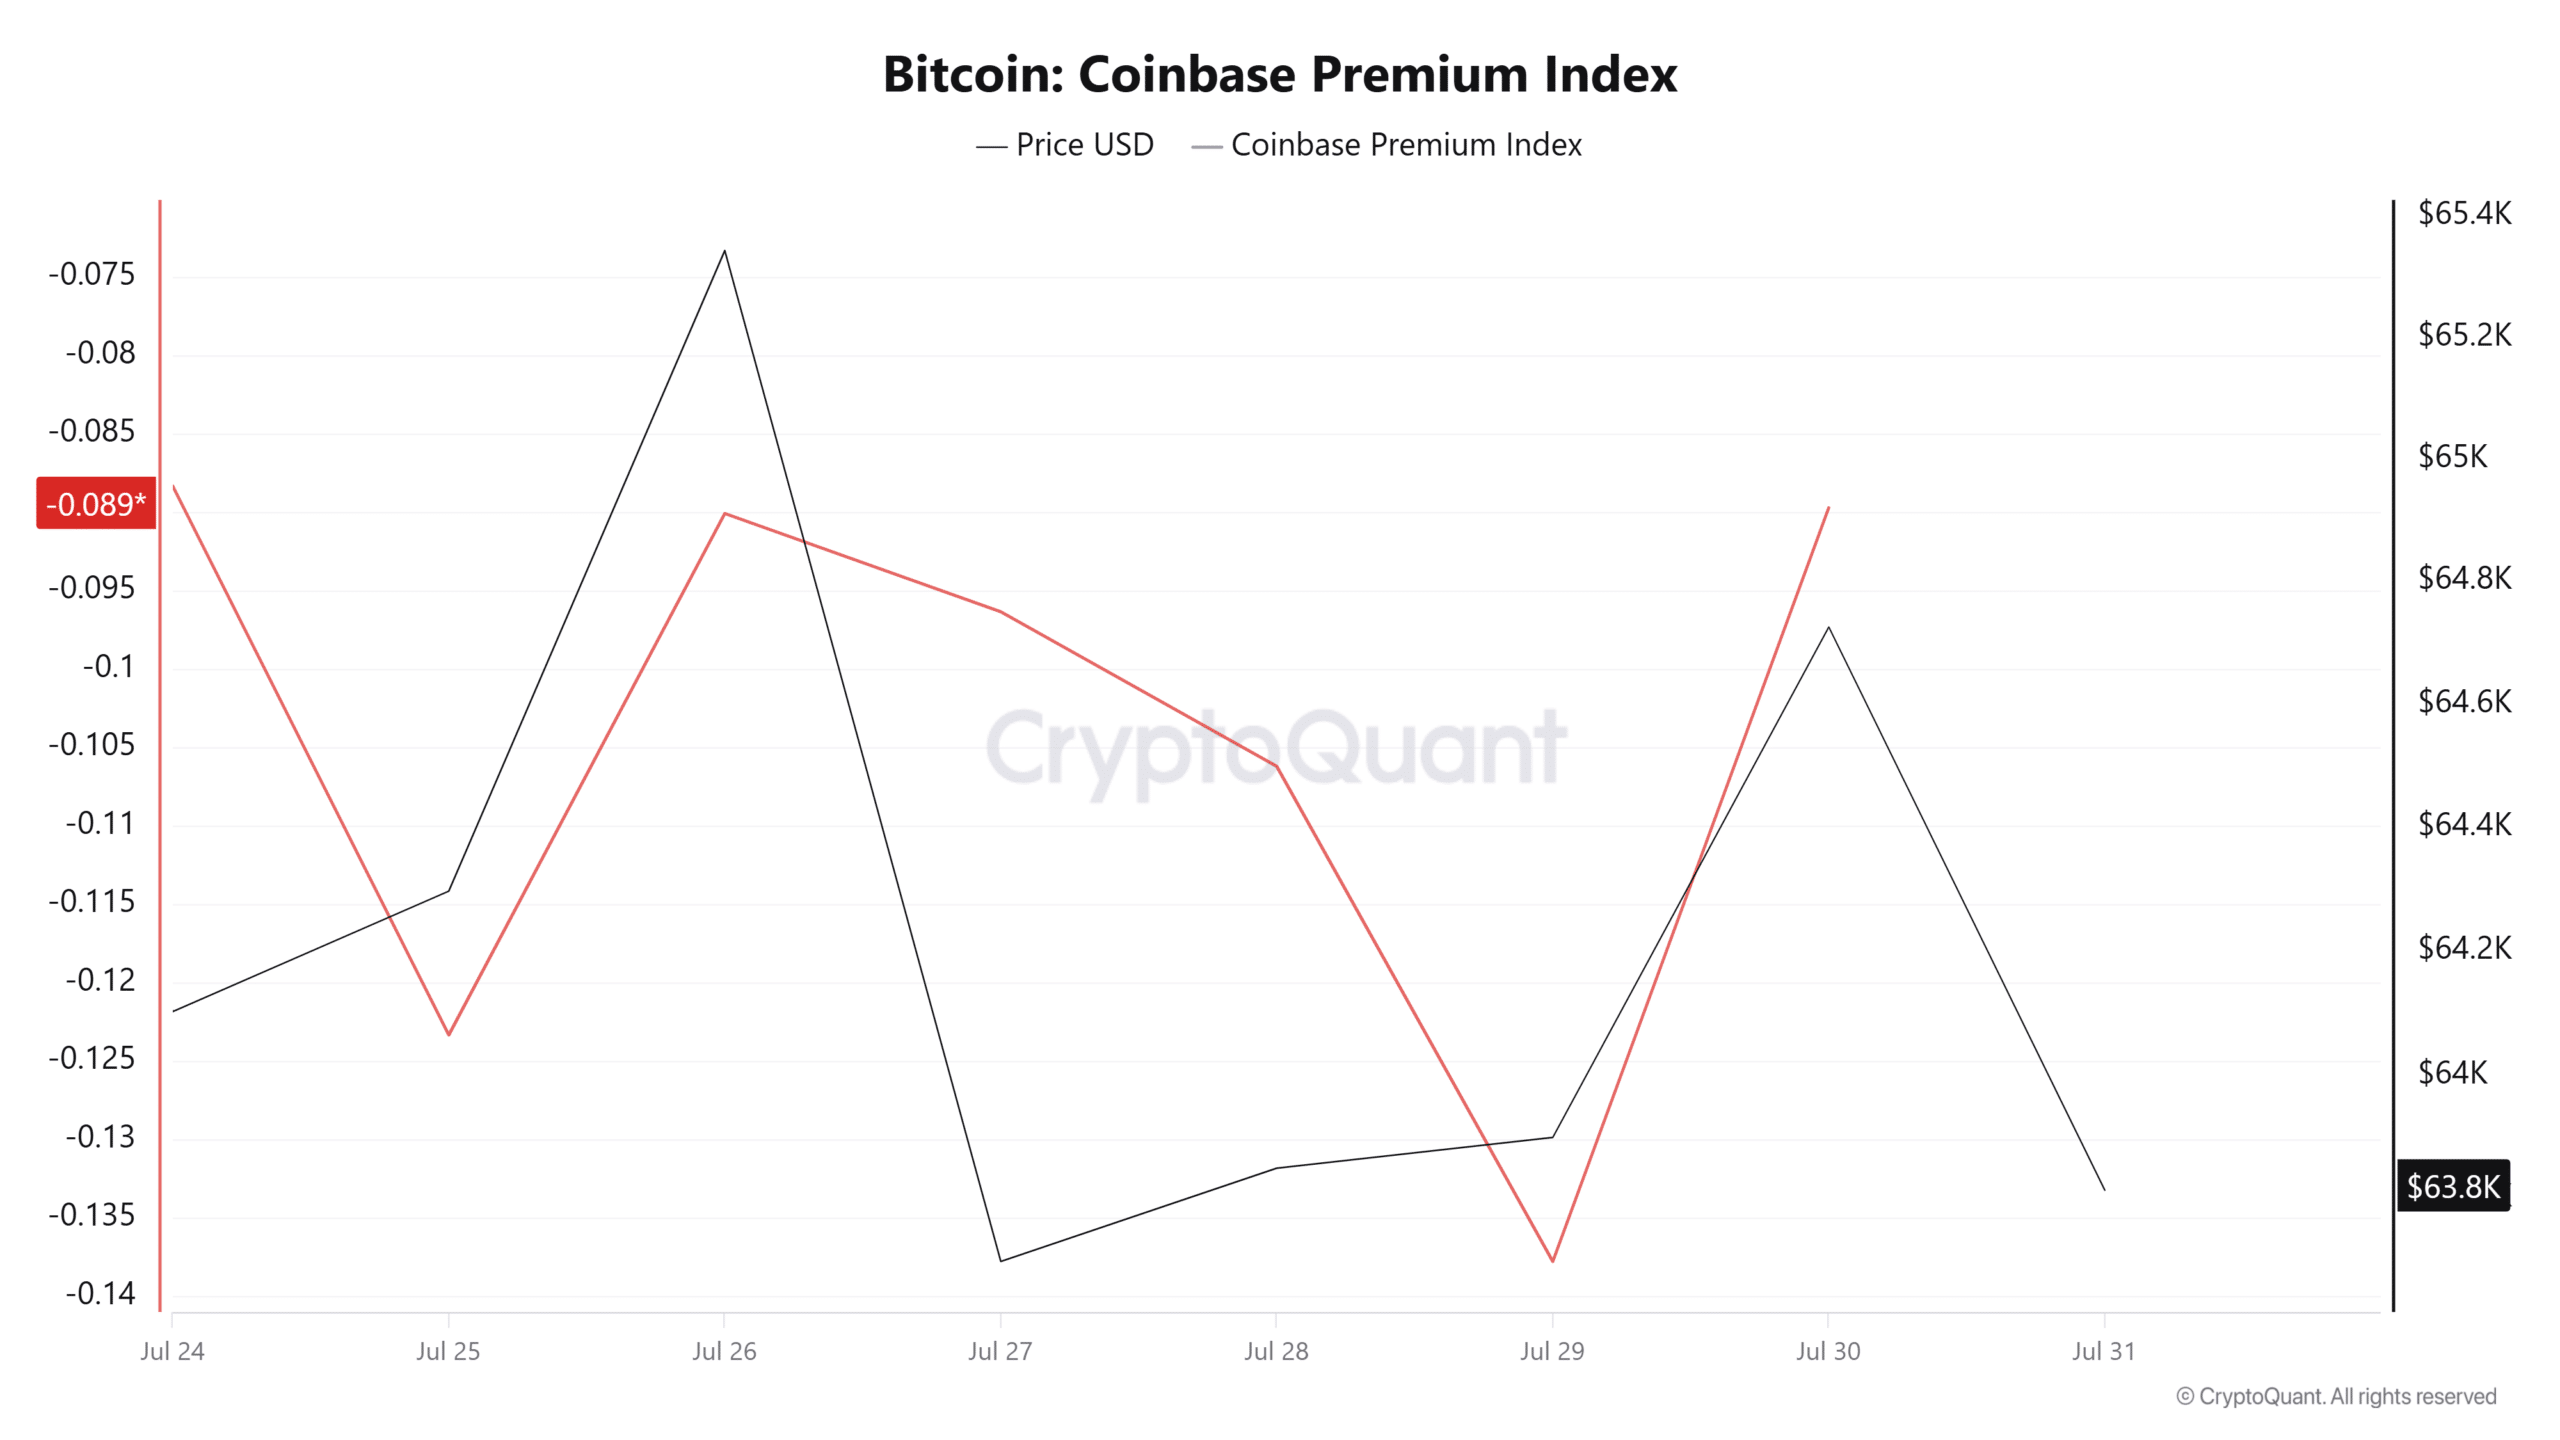
A negative reading meant Bitcoin traded cheaper on Coinbase than on Binance.
This suggested weaker demand from Coinbase-linked U.S. investors, rather than confirming that most American investors were selling. That divergence left uncertainty around whether ETF inflows could continue into August.
Can ETF demand lift Bitcoin?
Bitcoin’s Exchange Netflow remained positive for three consecutive days. At press time, approximately 2,900 BTC had entered exchanges on a net basis.
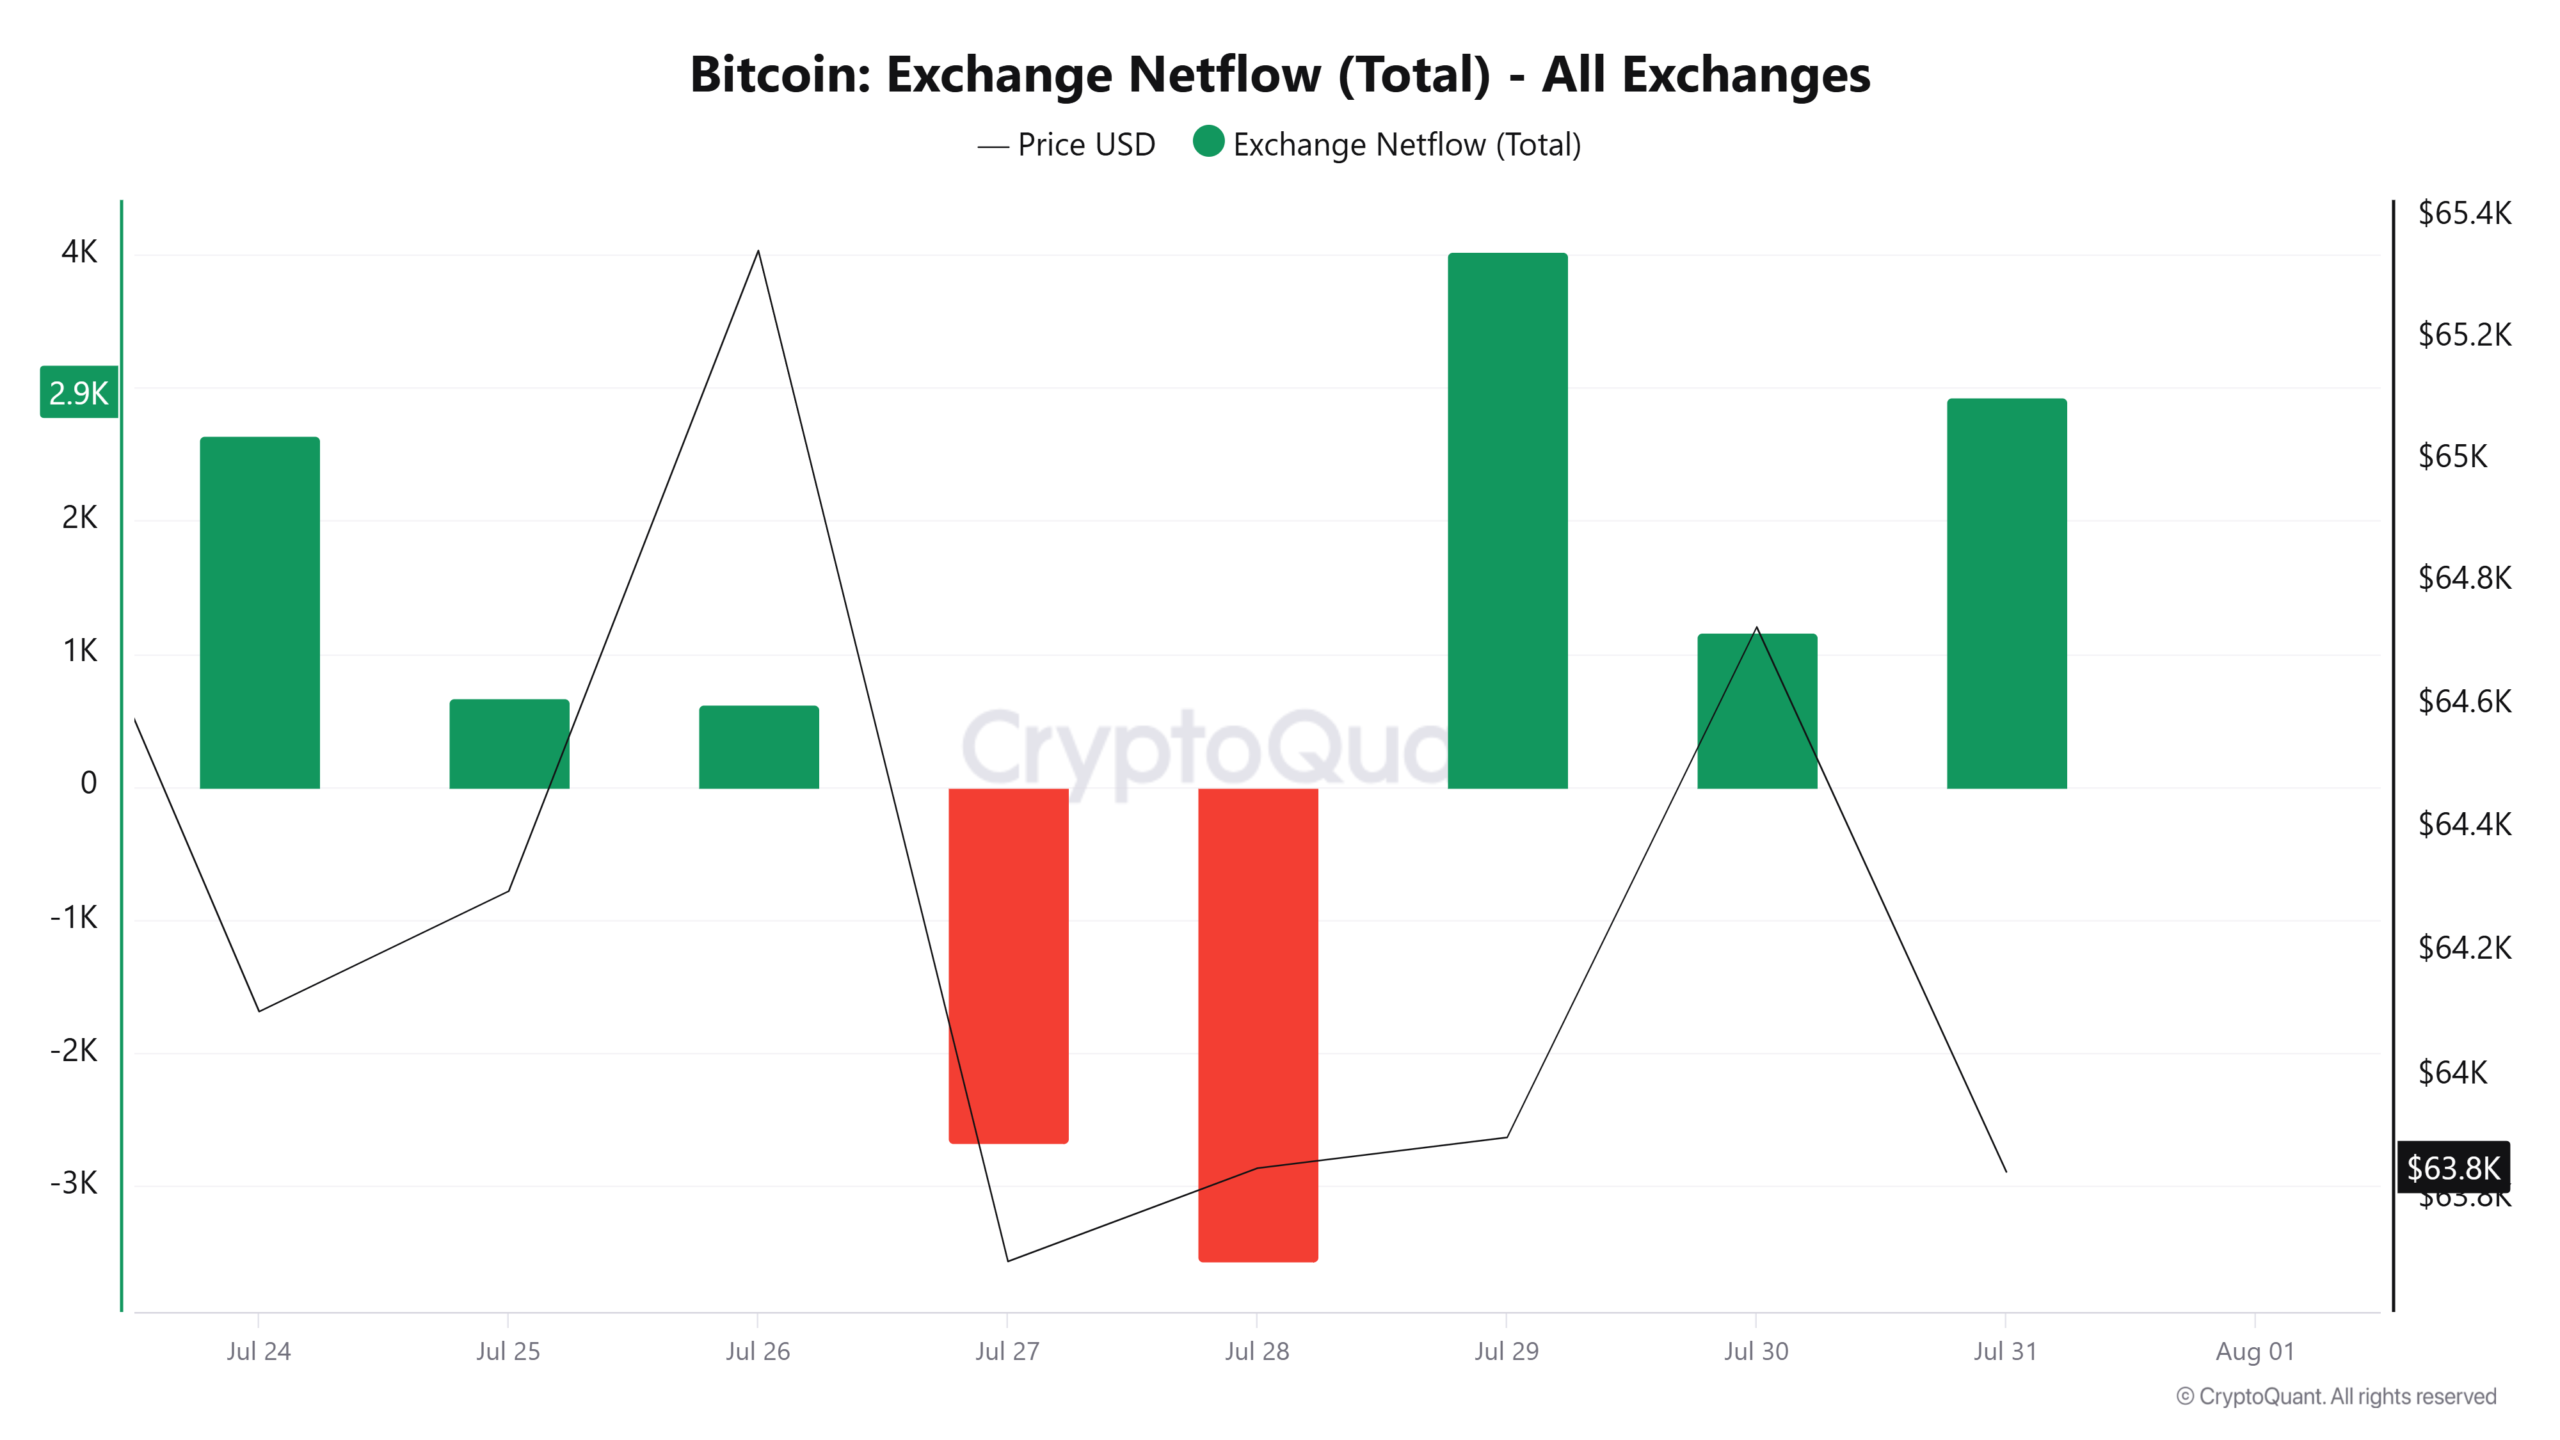
Positive Exchange Netflow indicated that more Bitcoin entered exchanges than left. This raised potential sell-side pressure without confirming completed sales.
By contrast, directional indicators continued to favor bears. Bitcoin’s positive Directional Indicator stood at 17, while its negative Directional Indicator reached 22.
Meanwhile, the Average Directional Index rose to 21. The readings showed that sellers held an advantage, although the wider trend lacked strong conviction.
Bitcoin’s Momentum Shift indicator also remained negative, reinforcing the weak market structure.
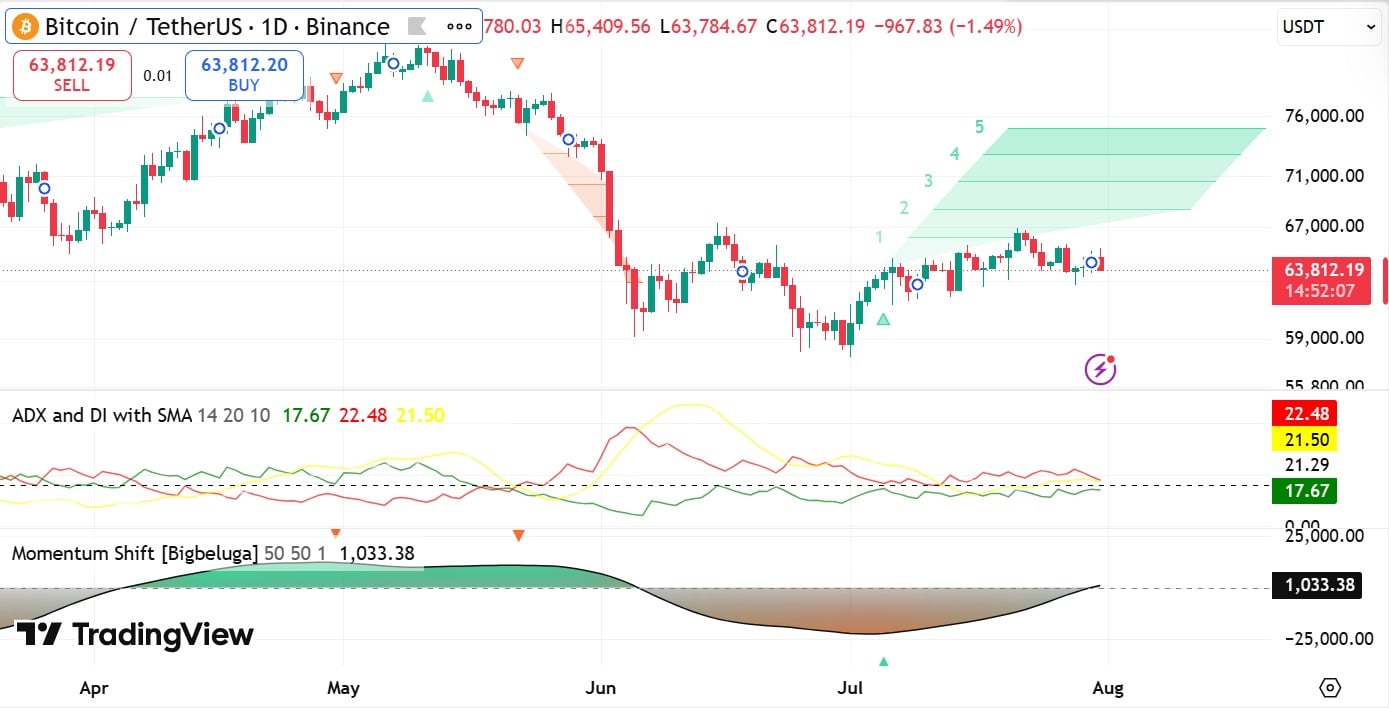
ETF inflows may slow the decline, but current demand appears insufficient to confirm a reversal.
A continued breakdown could pull BTC toward $62,000. Sustained institutional inflows may instead support a recovery toward $70,000.
Final Summary
- Fidelity’s FBTC reversed a $43 million outflow with $15.5 million in inflows.
- Daily Total Net Inflow across U.S. Spot Bitcoin ETFs reached a three-week high of $233 million.