Can Solana’s price reclaim the $83? What to expect as SOL stalls at $78
The support zone above $72 could determine if Solana's breakout rally will hold.



Solana’s price broke out of its month-long downtrend last weekend after surging above $75. However, the breakout rally stalled near $78 and has since given back some of the gains as of this writing.
Even so, bulls still have a better chance of pushing further if they defend a key immediate support.
Will Solana bulls defend the $72 golden zone?
On the price charts, the Q3 downtrend had eased right at the $72-$74 zone. This coincided with the 50% Fibonacci retracement level (golden zone). The level has historically acted as a pivotal zone for pullbacks.
If the slight retracement stops again at the zone with strong Spot demand, then $72 could become the mid-term support zone. If so, SOL could retarget the $83 level, which also acts as the 200-day Moving Average (MA).
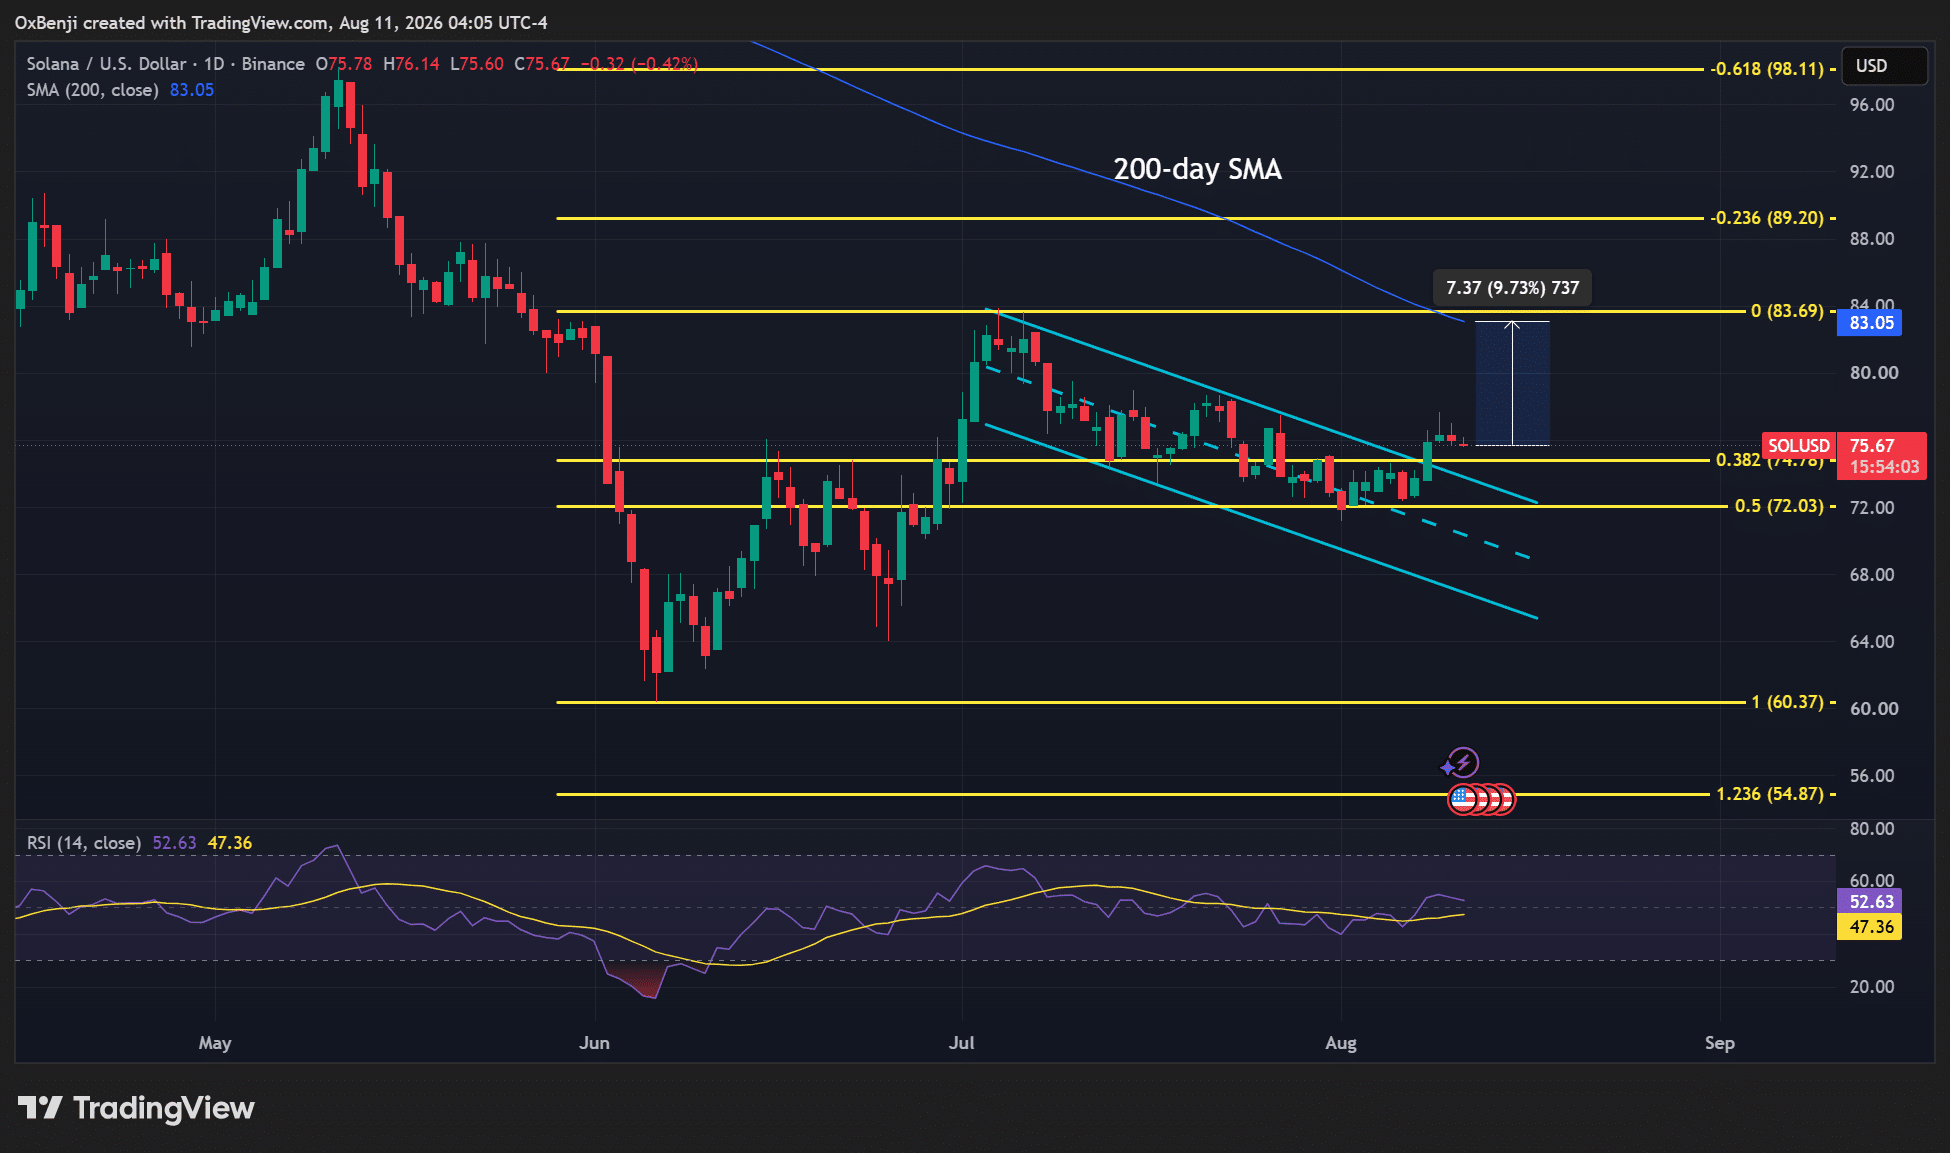
Decisively reclaiming the 200-day MA would flip the market structure bullish and open up further upside potential.
However, breaking below the crucial $72 demand zone would invalidate the bullish outlook. In such a scenario, more downside risks could be likely.
Smart money interest in Solana surges by 42%
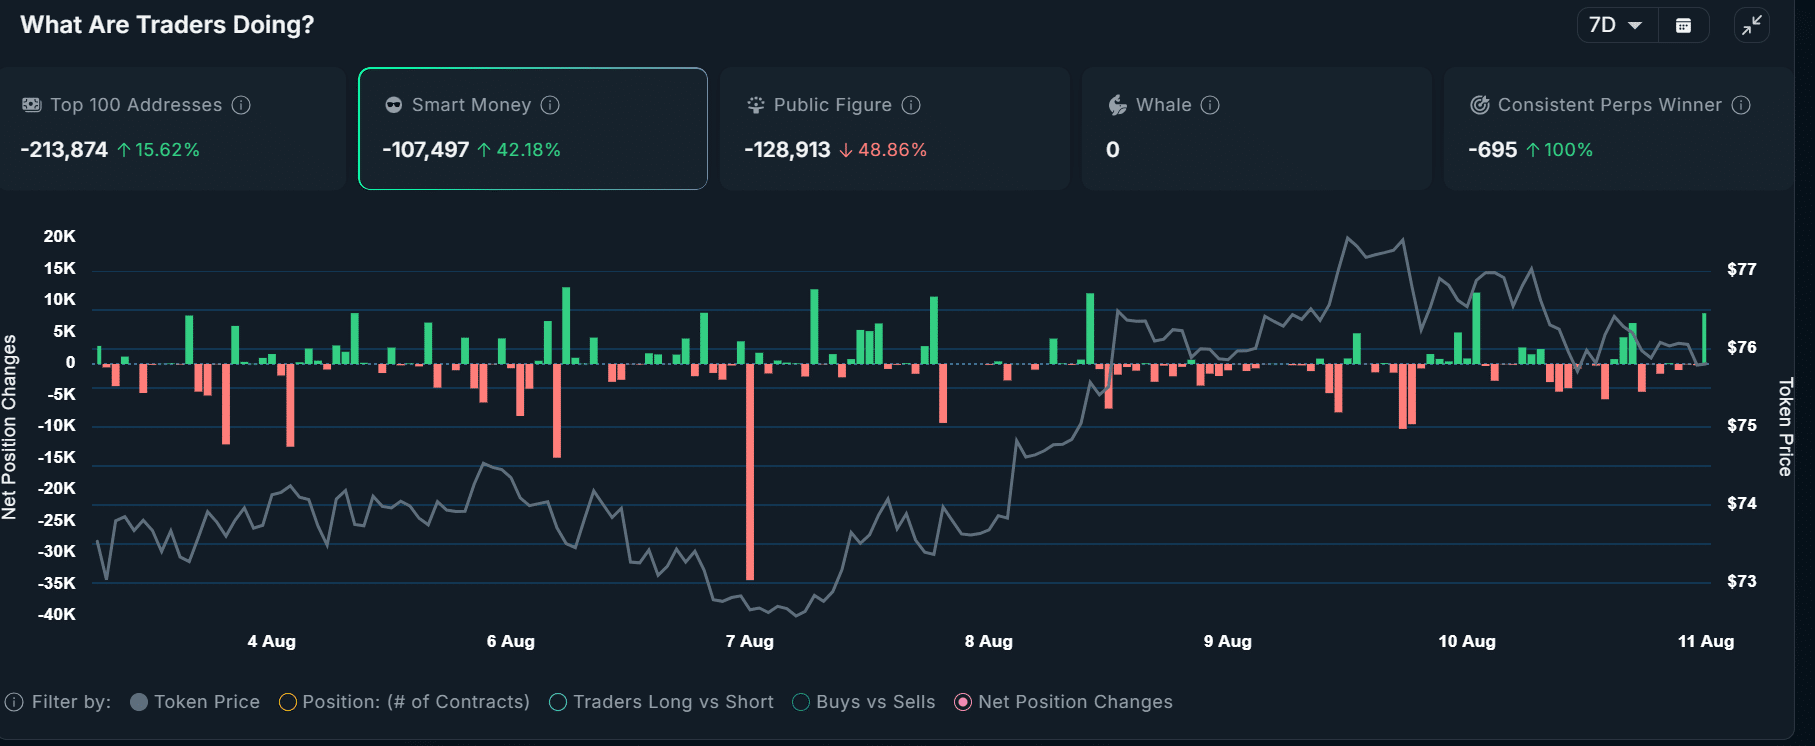
That said, smart money or sophisticated investors showed increased interest in Solana in the past seven days of trading. Notably, smart money increased by 42% while top addresses also increased bids by 15%.
Collectively, this showed that major whales and perhaps institutional players and professional traders were bullish on the altcoin.
Interestingly, similar institutional demand was also seen across U.S. Spot SOL ETFs. On Monday, the 11th of August, the products posted $8.8M in daily net inflows. This rivaled BTC and ETH ETFs, which saw net daily outflows on Monday.
In fact, U.S. Spot SOL ETF demand has been fairly positive in Q3 despite being relatively low compared to Q2.
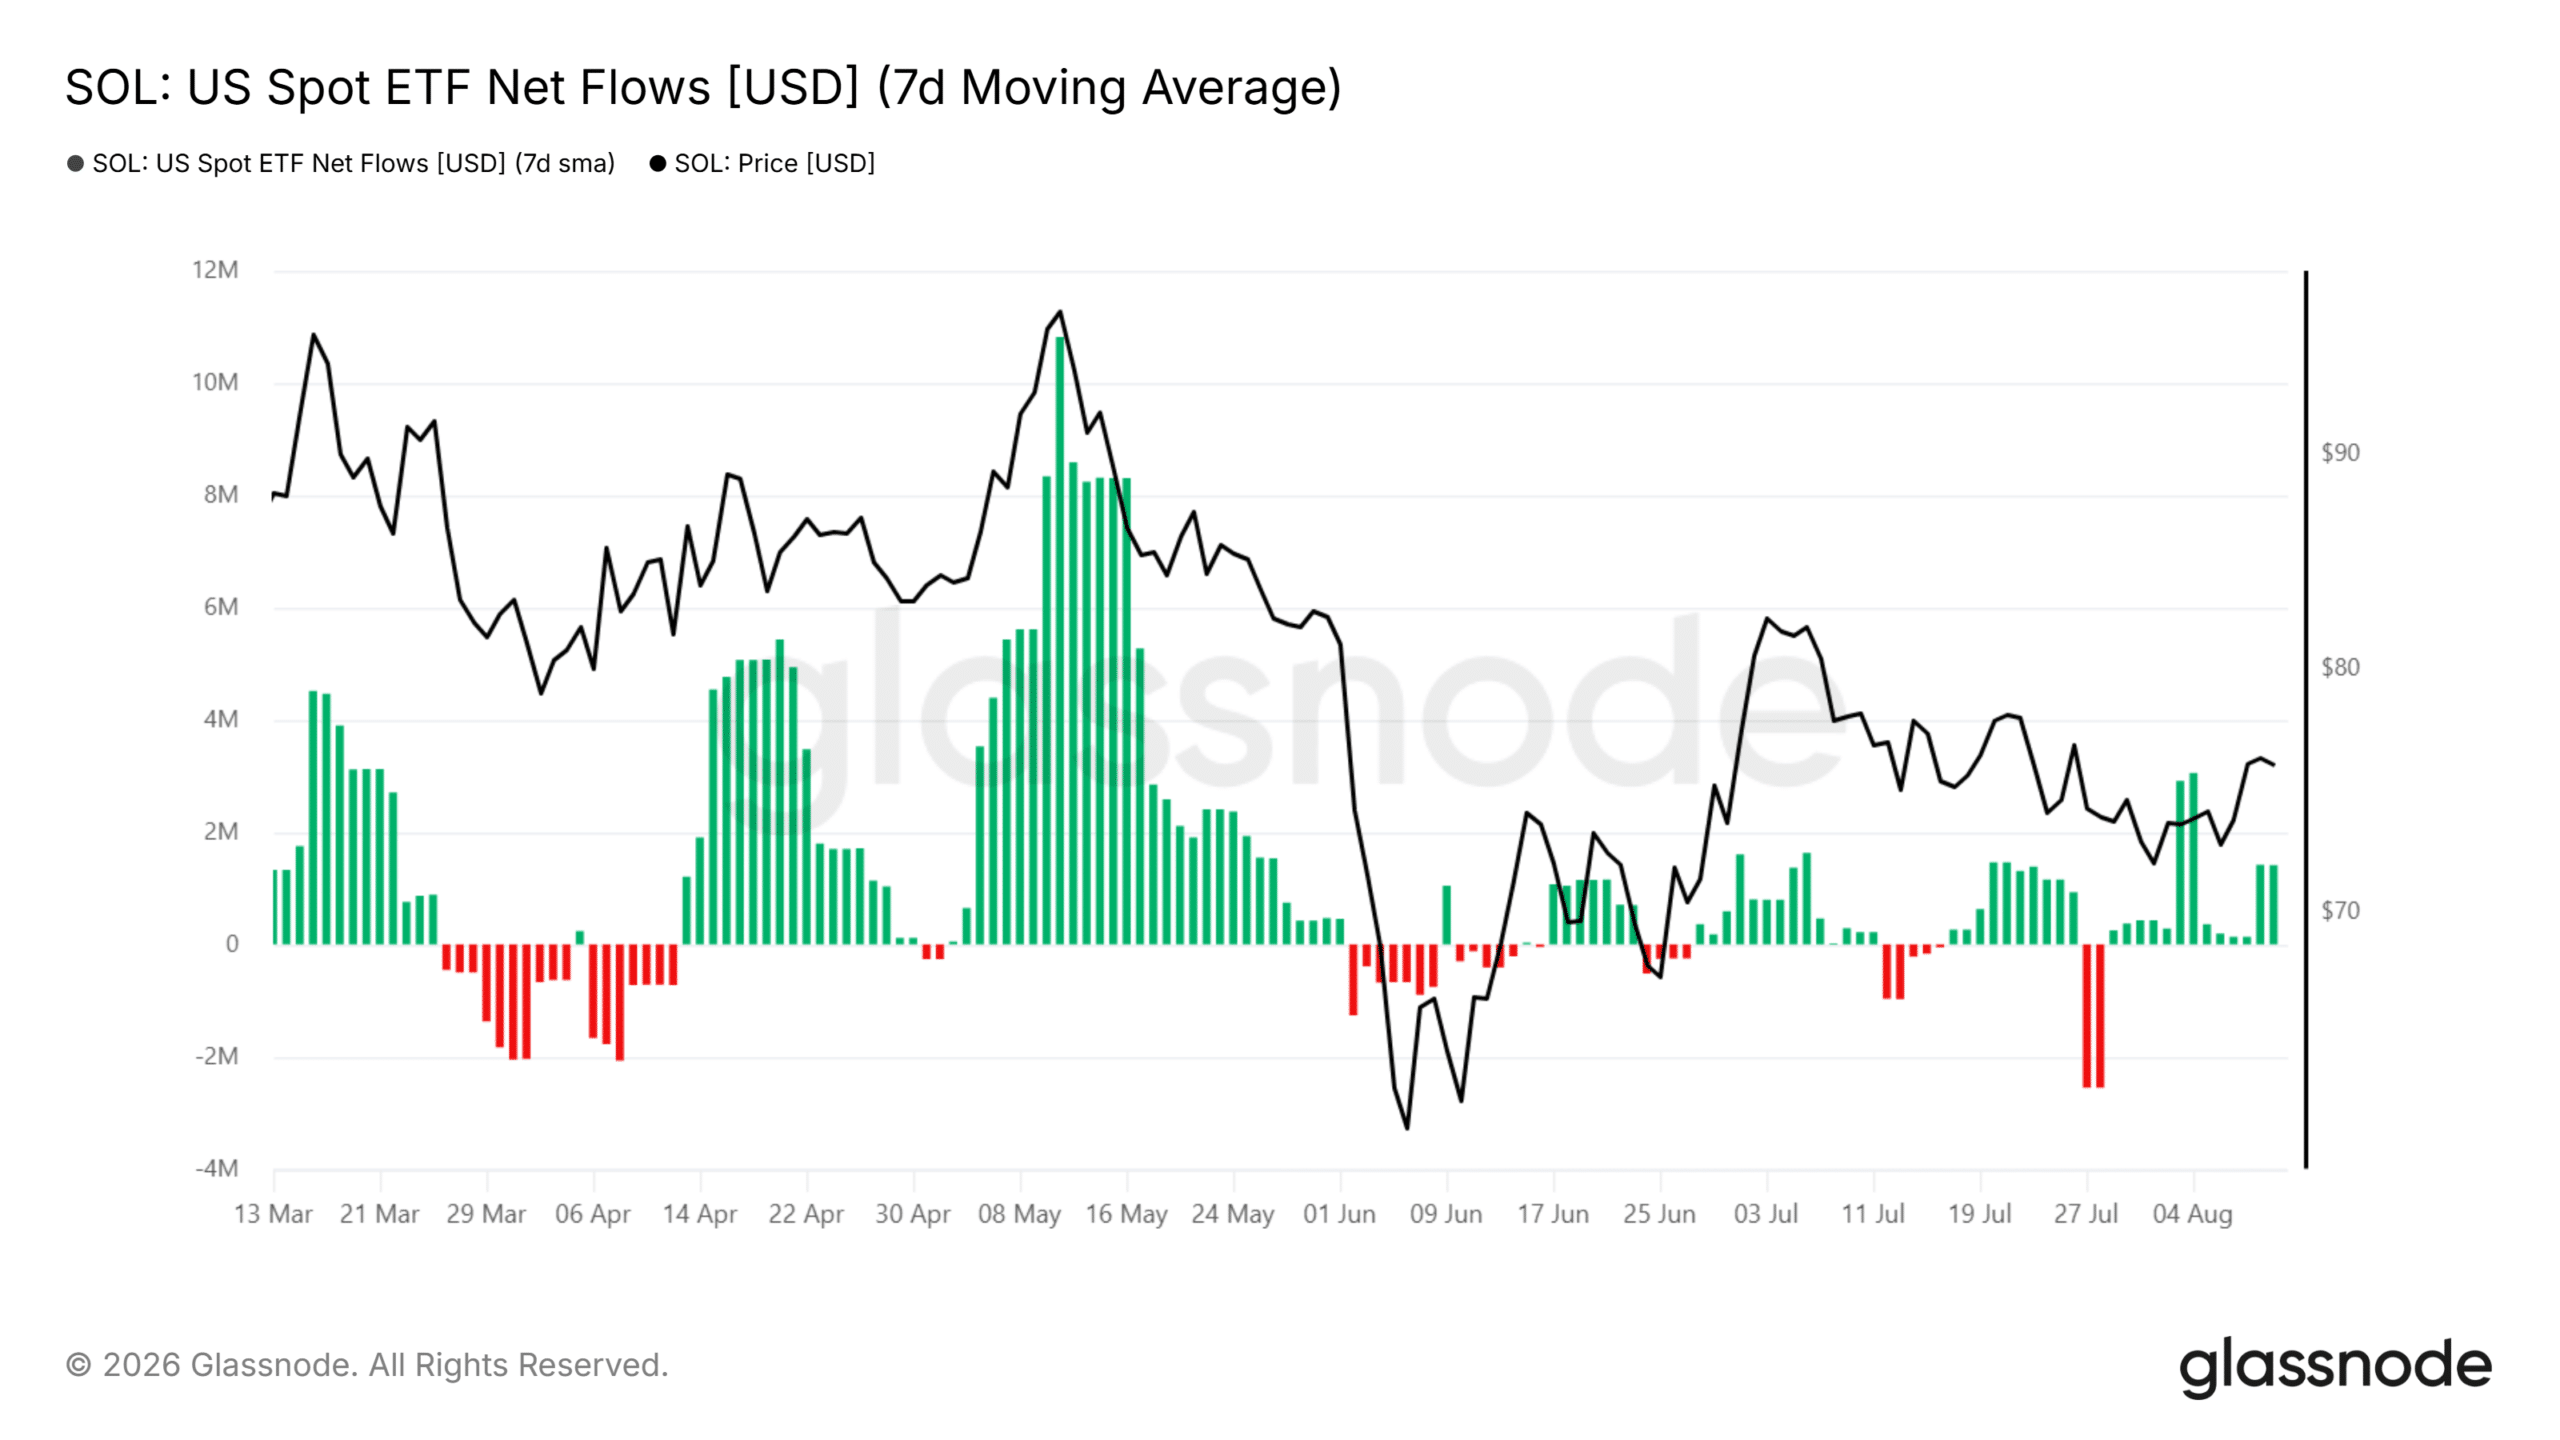
But whether the institutional appetite will continue in Q3 despite upcoming U.S inflation data and possible Fed rate hike fears remains to be seen.
Overall, Solana [SOL] fronted a bullish breakout from its July downtrend channel. The rally could extend if it’s supported by strong U.S. Spot ETF demand. If so, the $72 could still be a buying opportunity. Unfortunately, macro risks remain at large.
Final Summary
- Solana price broke out of its July downtrend and could post an extra 10% gain.
- There was renewed institutional demand after $8.8M daily net inflows on 10th August.