Chainlink crypto slips 8% after CCIP 2.0 launch – Can LINK hold $12?
The higher-timeframe Chainlink crypto price bias was bullish, but the altcoin was affected by October's market-wide correction.



The Chainlink [LINK] Cross-Chain Interoperability Program (CCIP) version 2.0 was released on the 28th of September. The groundwork for its Q4 cycle was laid, it was reported. Yet, the LINK price is down 8.12% from the $14.02 daily session open on the same day.
Moreover, the price drawdown was part of the wider crypto market sell-off. Chainlink crypto maintained its bullish overall trend, but investors were not extremely enthusiastic about the immediate bullish prospects.
Though the CCIP represented a sturdier bridge, the altcoin is also subject to macro conditions and LINK-specific sentiment shifts.
A call for a Chainlink crypto dump
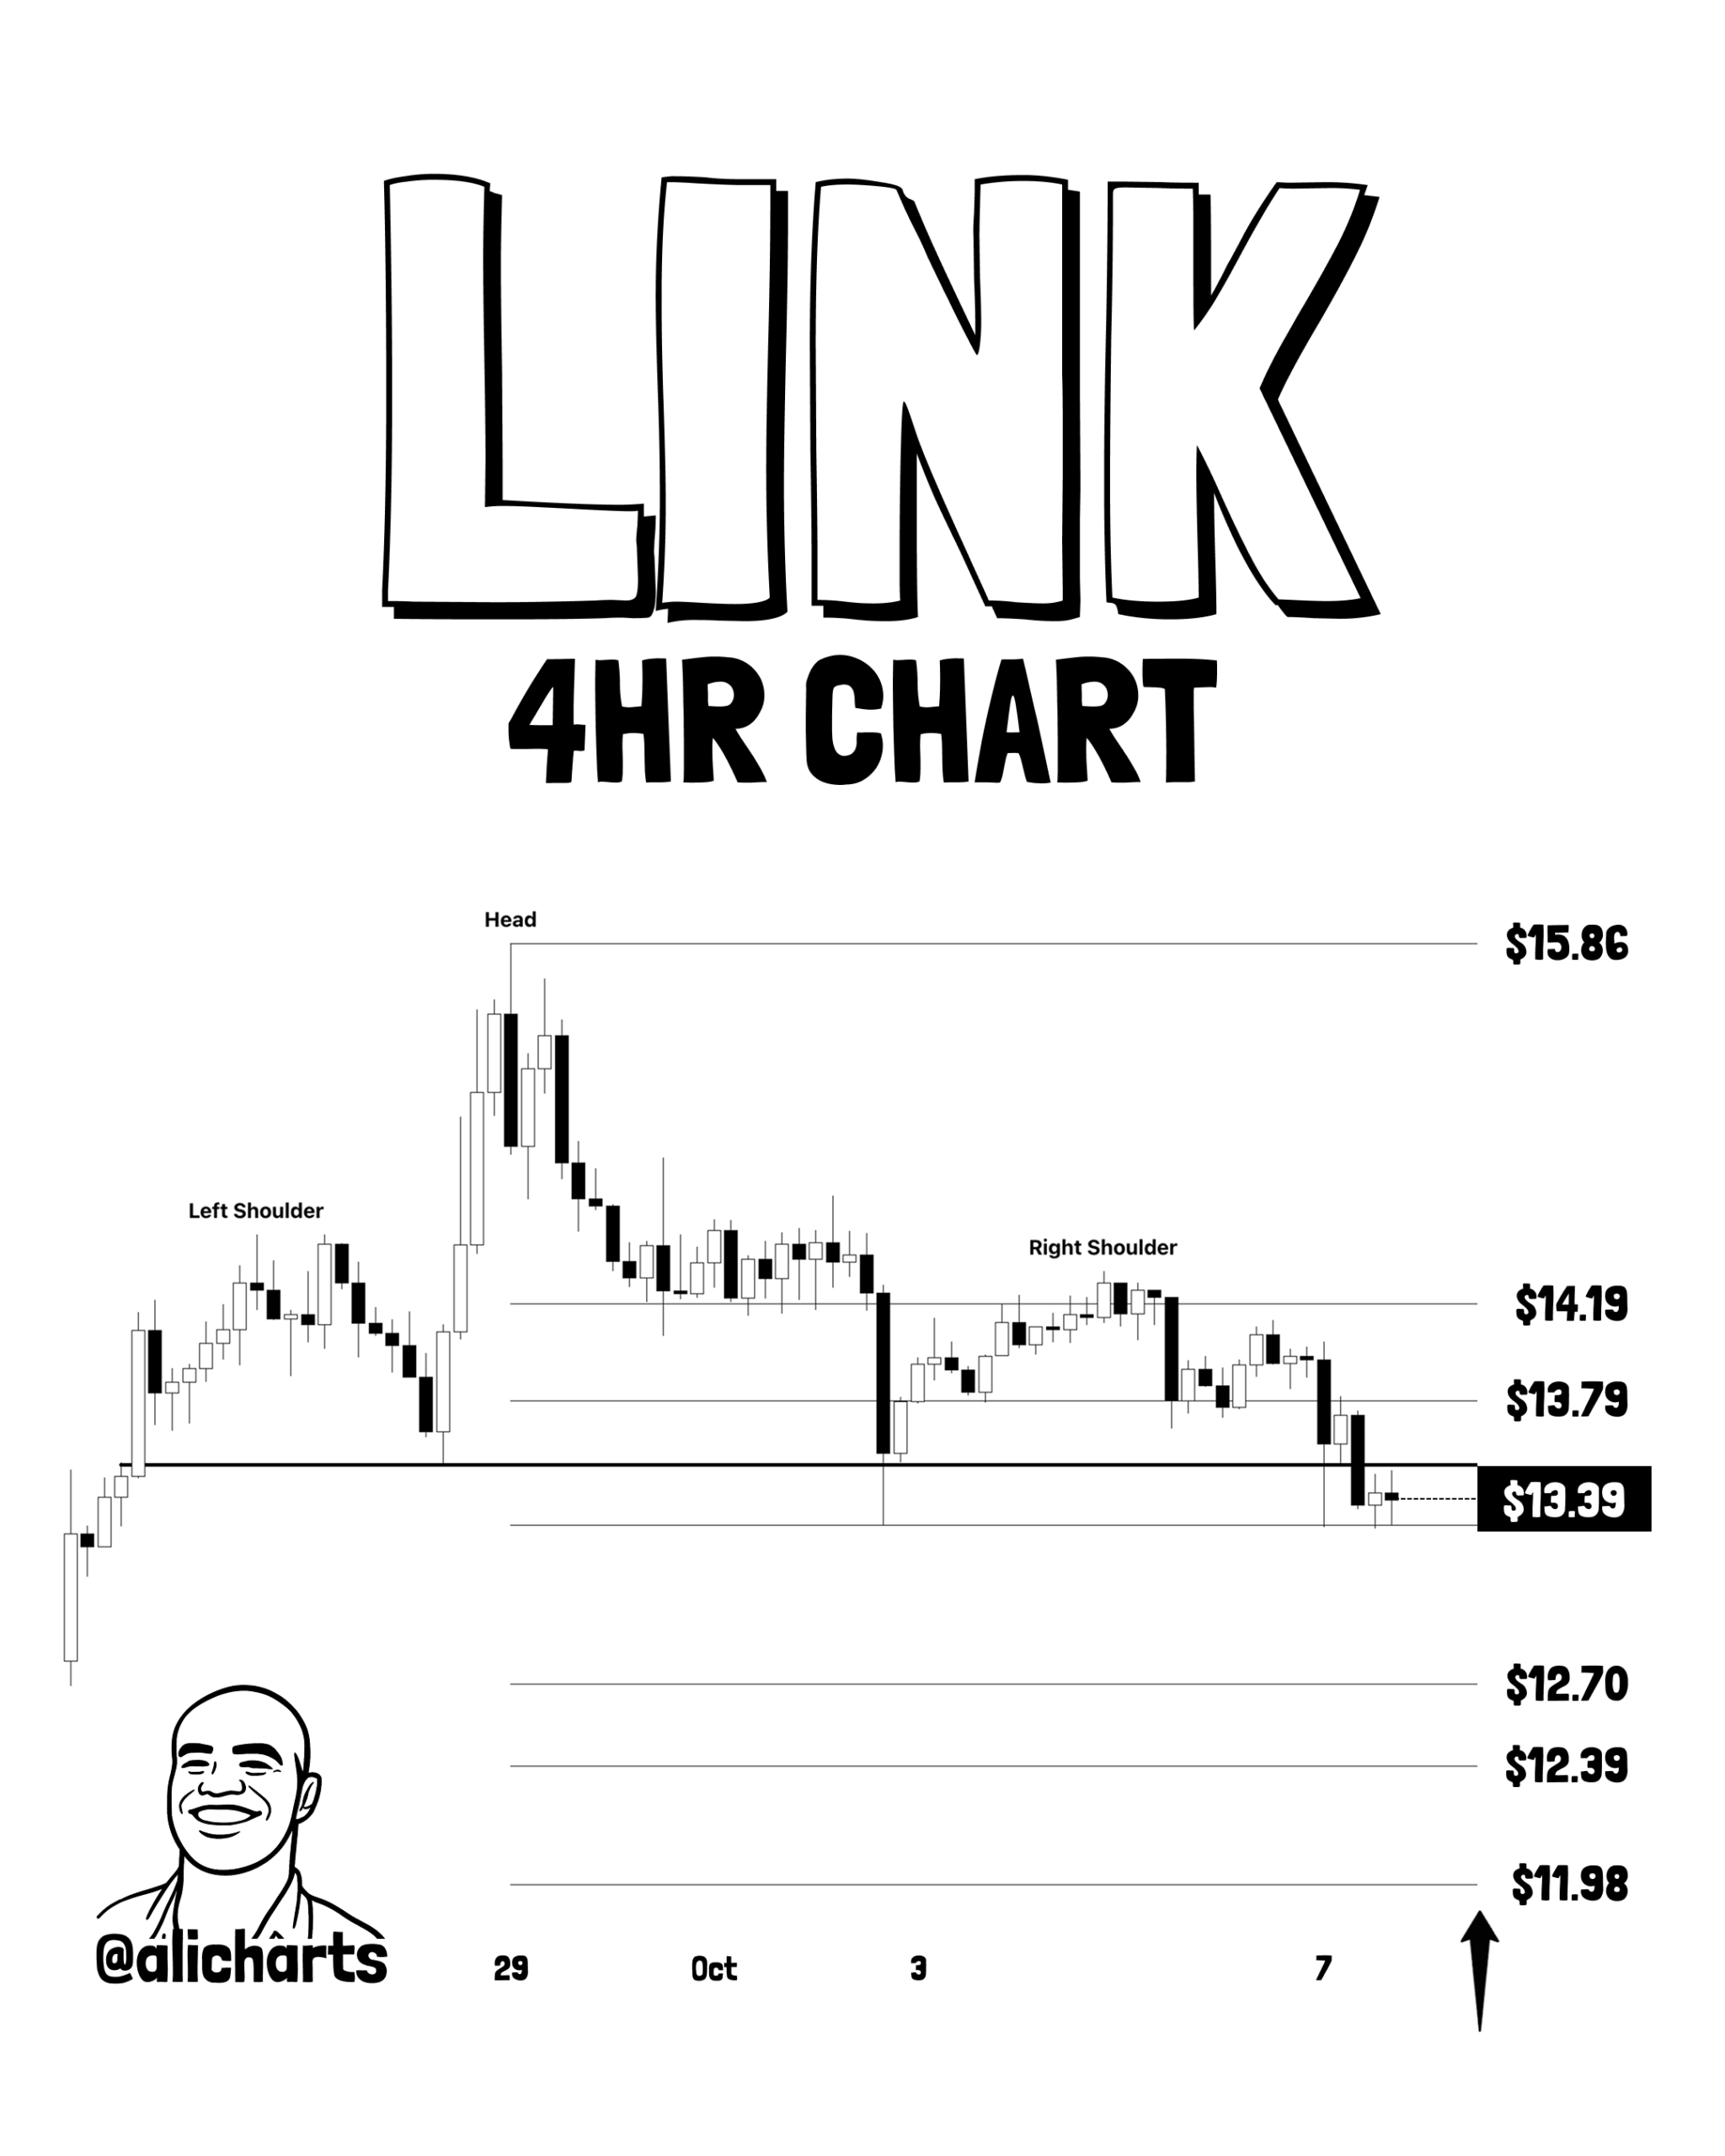
A crypto analyst observed that Chainlink crypto was breaking below the neckline of a head-and-shoulders pattern it had formed on the 4-hour timeframe.
If LINK continued to trade below $13.56, the chances of a continued price move down toward $12.39 and $11.98 remained likely.
Towards the end of September, the chances of a Chainlink rally beyond $15 were good. However, the altcoin fell below a rising trendline support from mid-September, shifting its short-term bias bearishly.
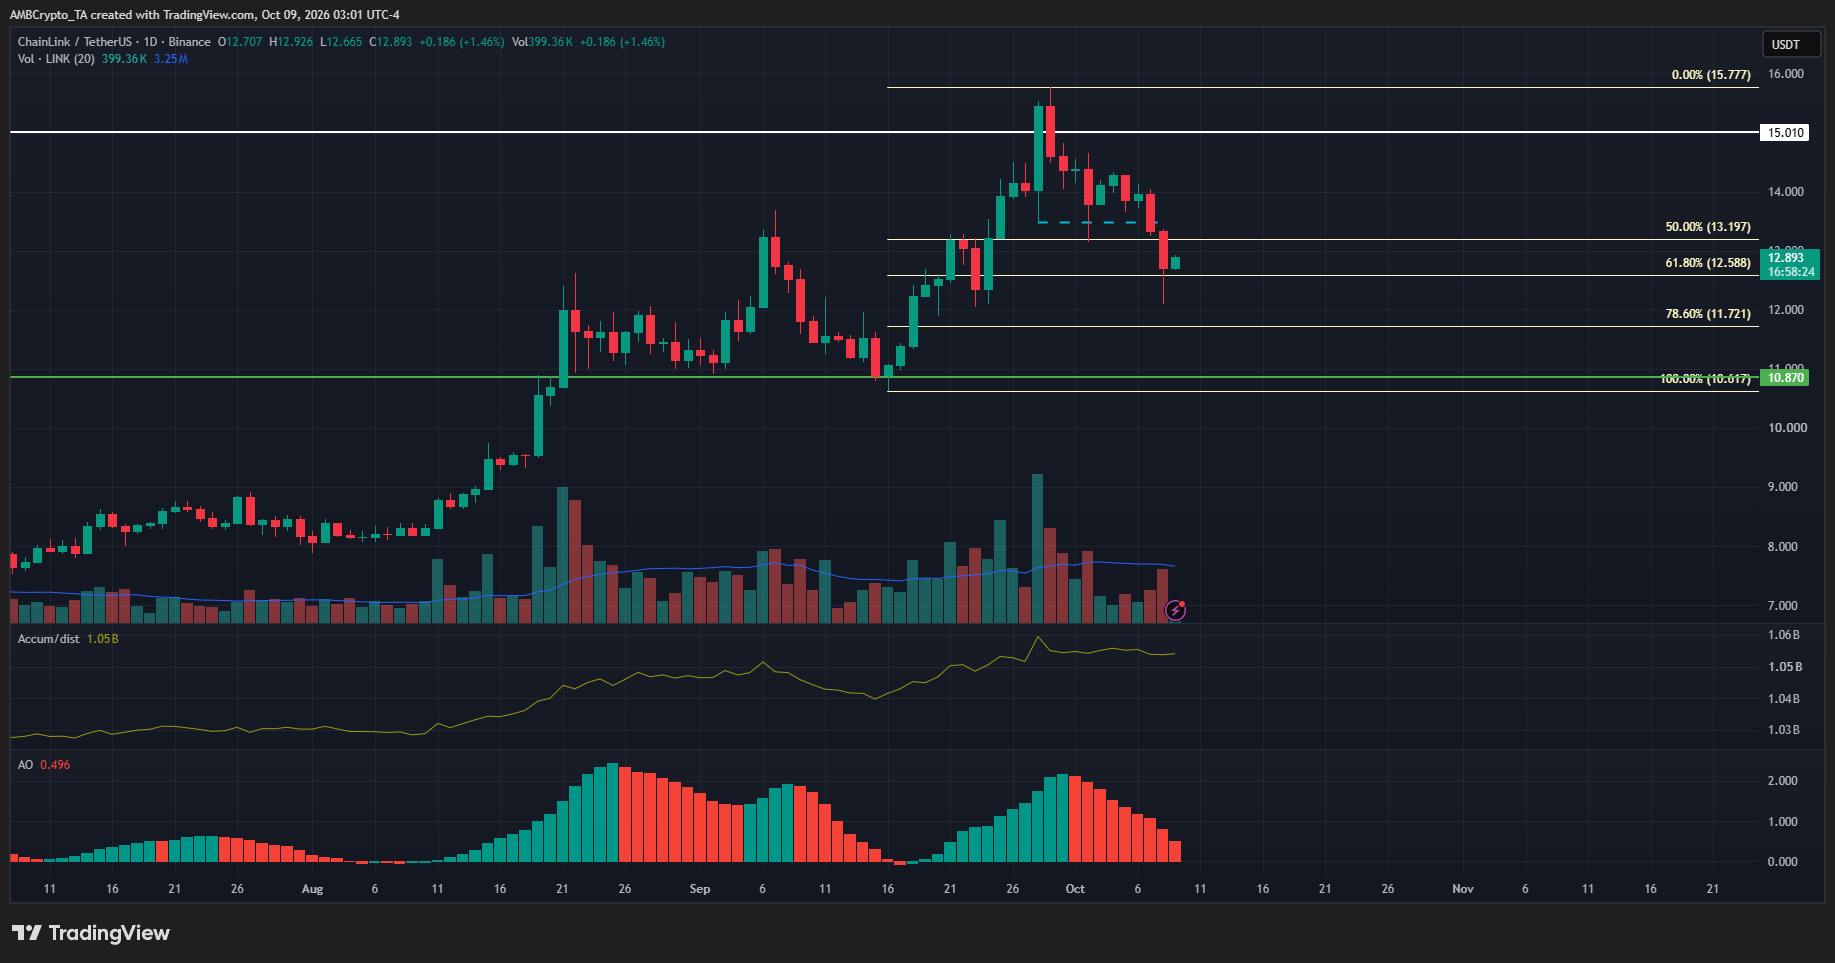
On the daily timeframe, the swing structure was bullish. The $12 area was key, with multiple candlewicks to it over the past two weeks. It is possible that LINK would dip briefly below $12 to sweep the liquidation levels below before recovering.
The A/D indicator continued to show buyers were dominant. The Awesome Oscillator highlighted some short-term bearish momentum, but the indicator remained above zero to showcase overall bullishness.
Should Chainlink traders wait?
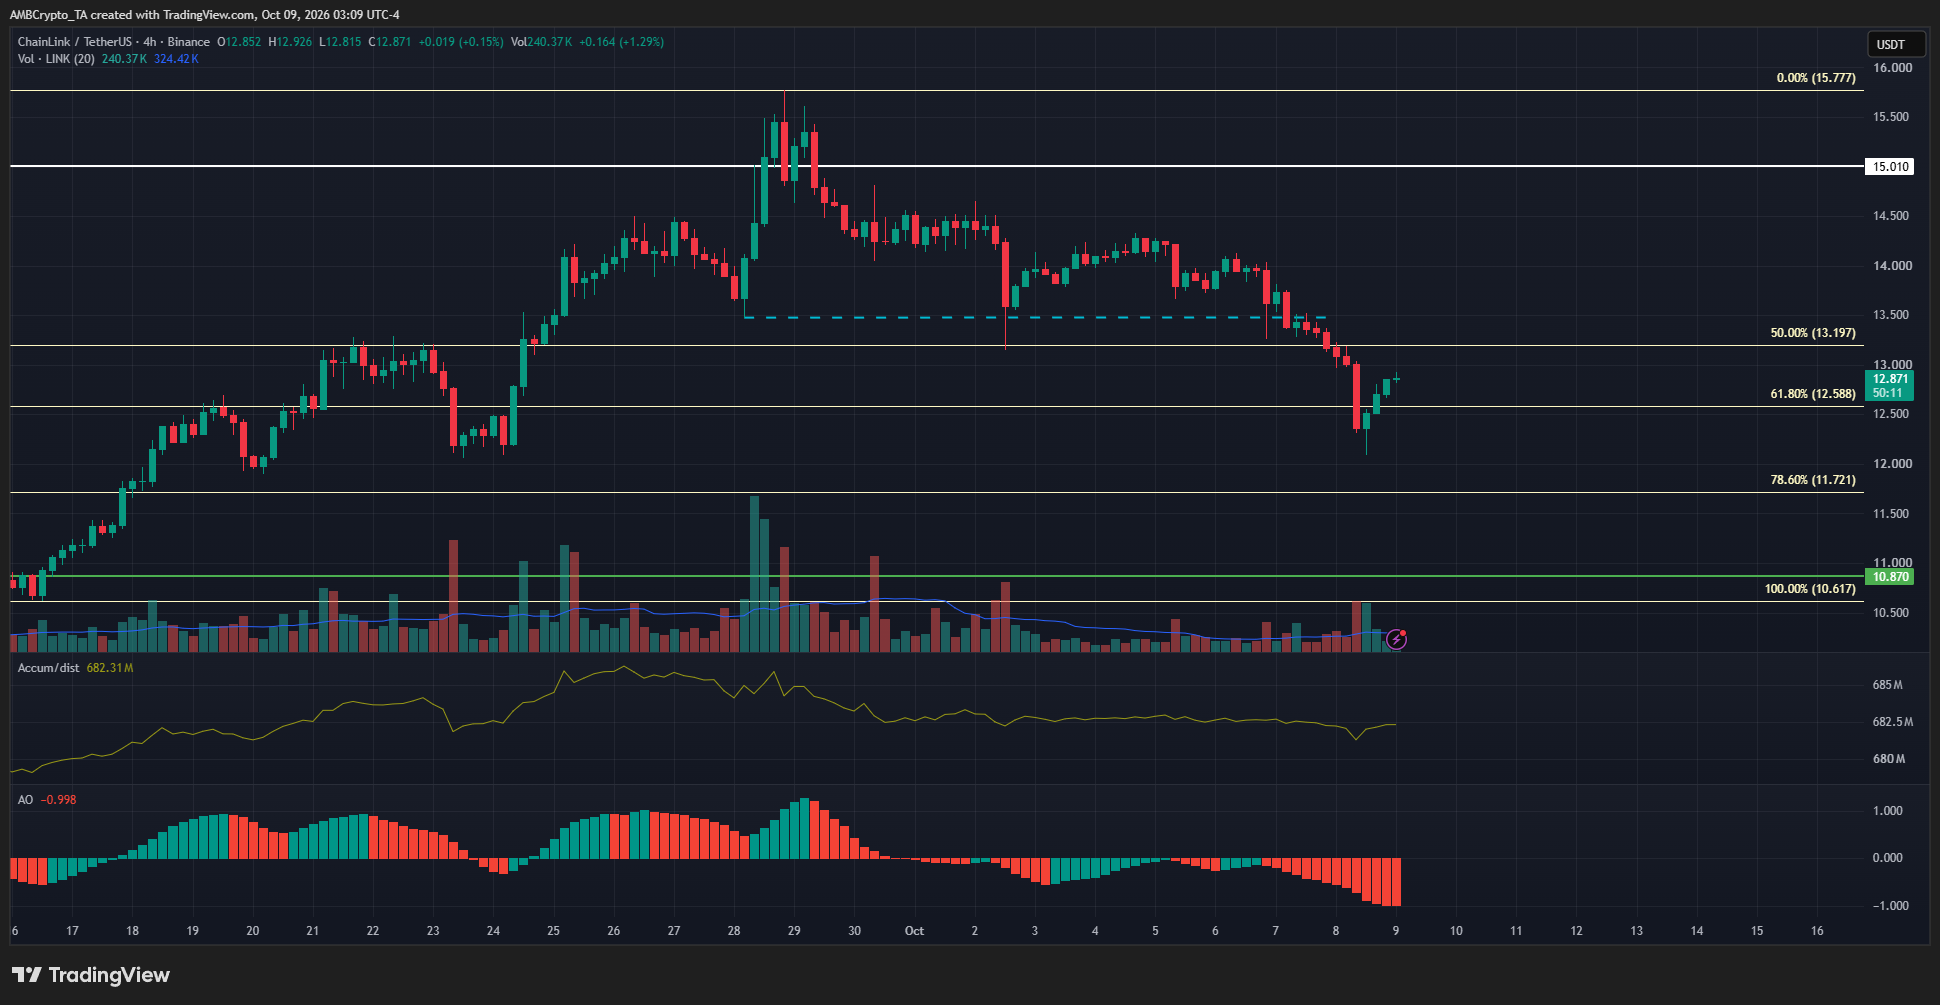
The 4-hour timeframe’s structure shifted bearishly when the $13.47 swing low (dotted cyan) was breached a few days ago. The technical indicators showed heightened sell pressure and downward momentum in October.
Notably, a deeper retracement toward the 78.6% Fibonacci retracement level at $11.72 was possible. Moreover, buyers can wait for a positive price reaction from $11.72-$12.0 before looking to buy.
Final Summary
- The CCIP 2.0 upgrade introduced in late September fueled a price move to $15.77, but LINK has since retraced by 18.4%.
- The higher-timeframe Chainlink crypto price bias was bullish, but the altcoin was affected by October’s market-wide correction.