Chainlink struggles below $9 as flat volume indicators urge caution
The LINK 1-day timeframe's price action has a bearish structure, and the $10 area is a key resistance zone.



Recently, AMBCrypto reported that the onchain activity for Chainlink [LINK] has weakened considerably. The transaction count crashed by 92.6%, from 5.2 million to just 386,000, according to Artemis data.
Total user count also fell from 2,700 to just 1,000. The $8.80 area was a key local resistance zone. LINK bulls have been trying to drive token prices past this zone since mid-June, but have not had much success.
Against this backdrop, a popular analyst projected a 22% rally toward $10.77 if the overhead supply zone was breached.
Here’s the breakdown of the signals and what the price action showed.
Whale activity and MVRV golden cross support the idea of a LINK surge
Crypto analyst Ali Martinez pointed out a series of signals that showed bullish potential for Chainlink.
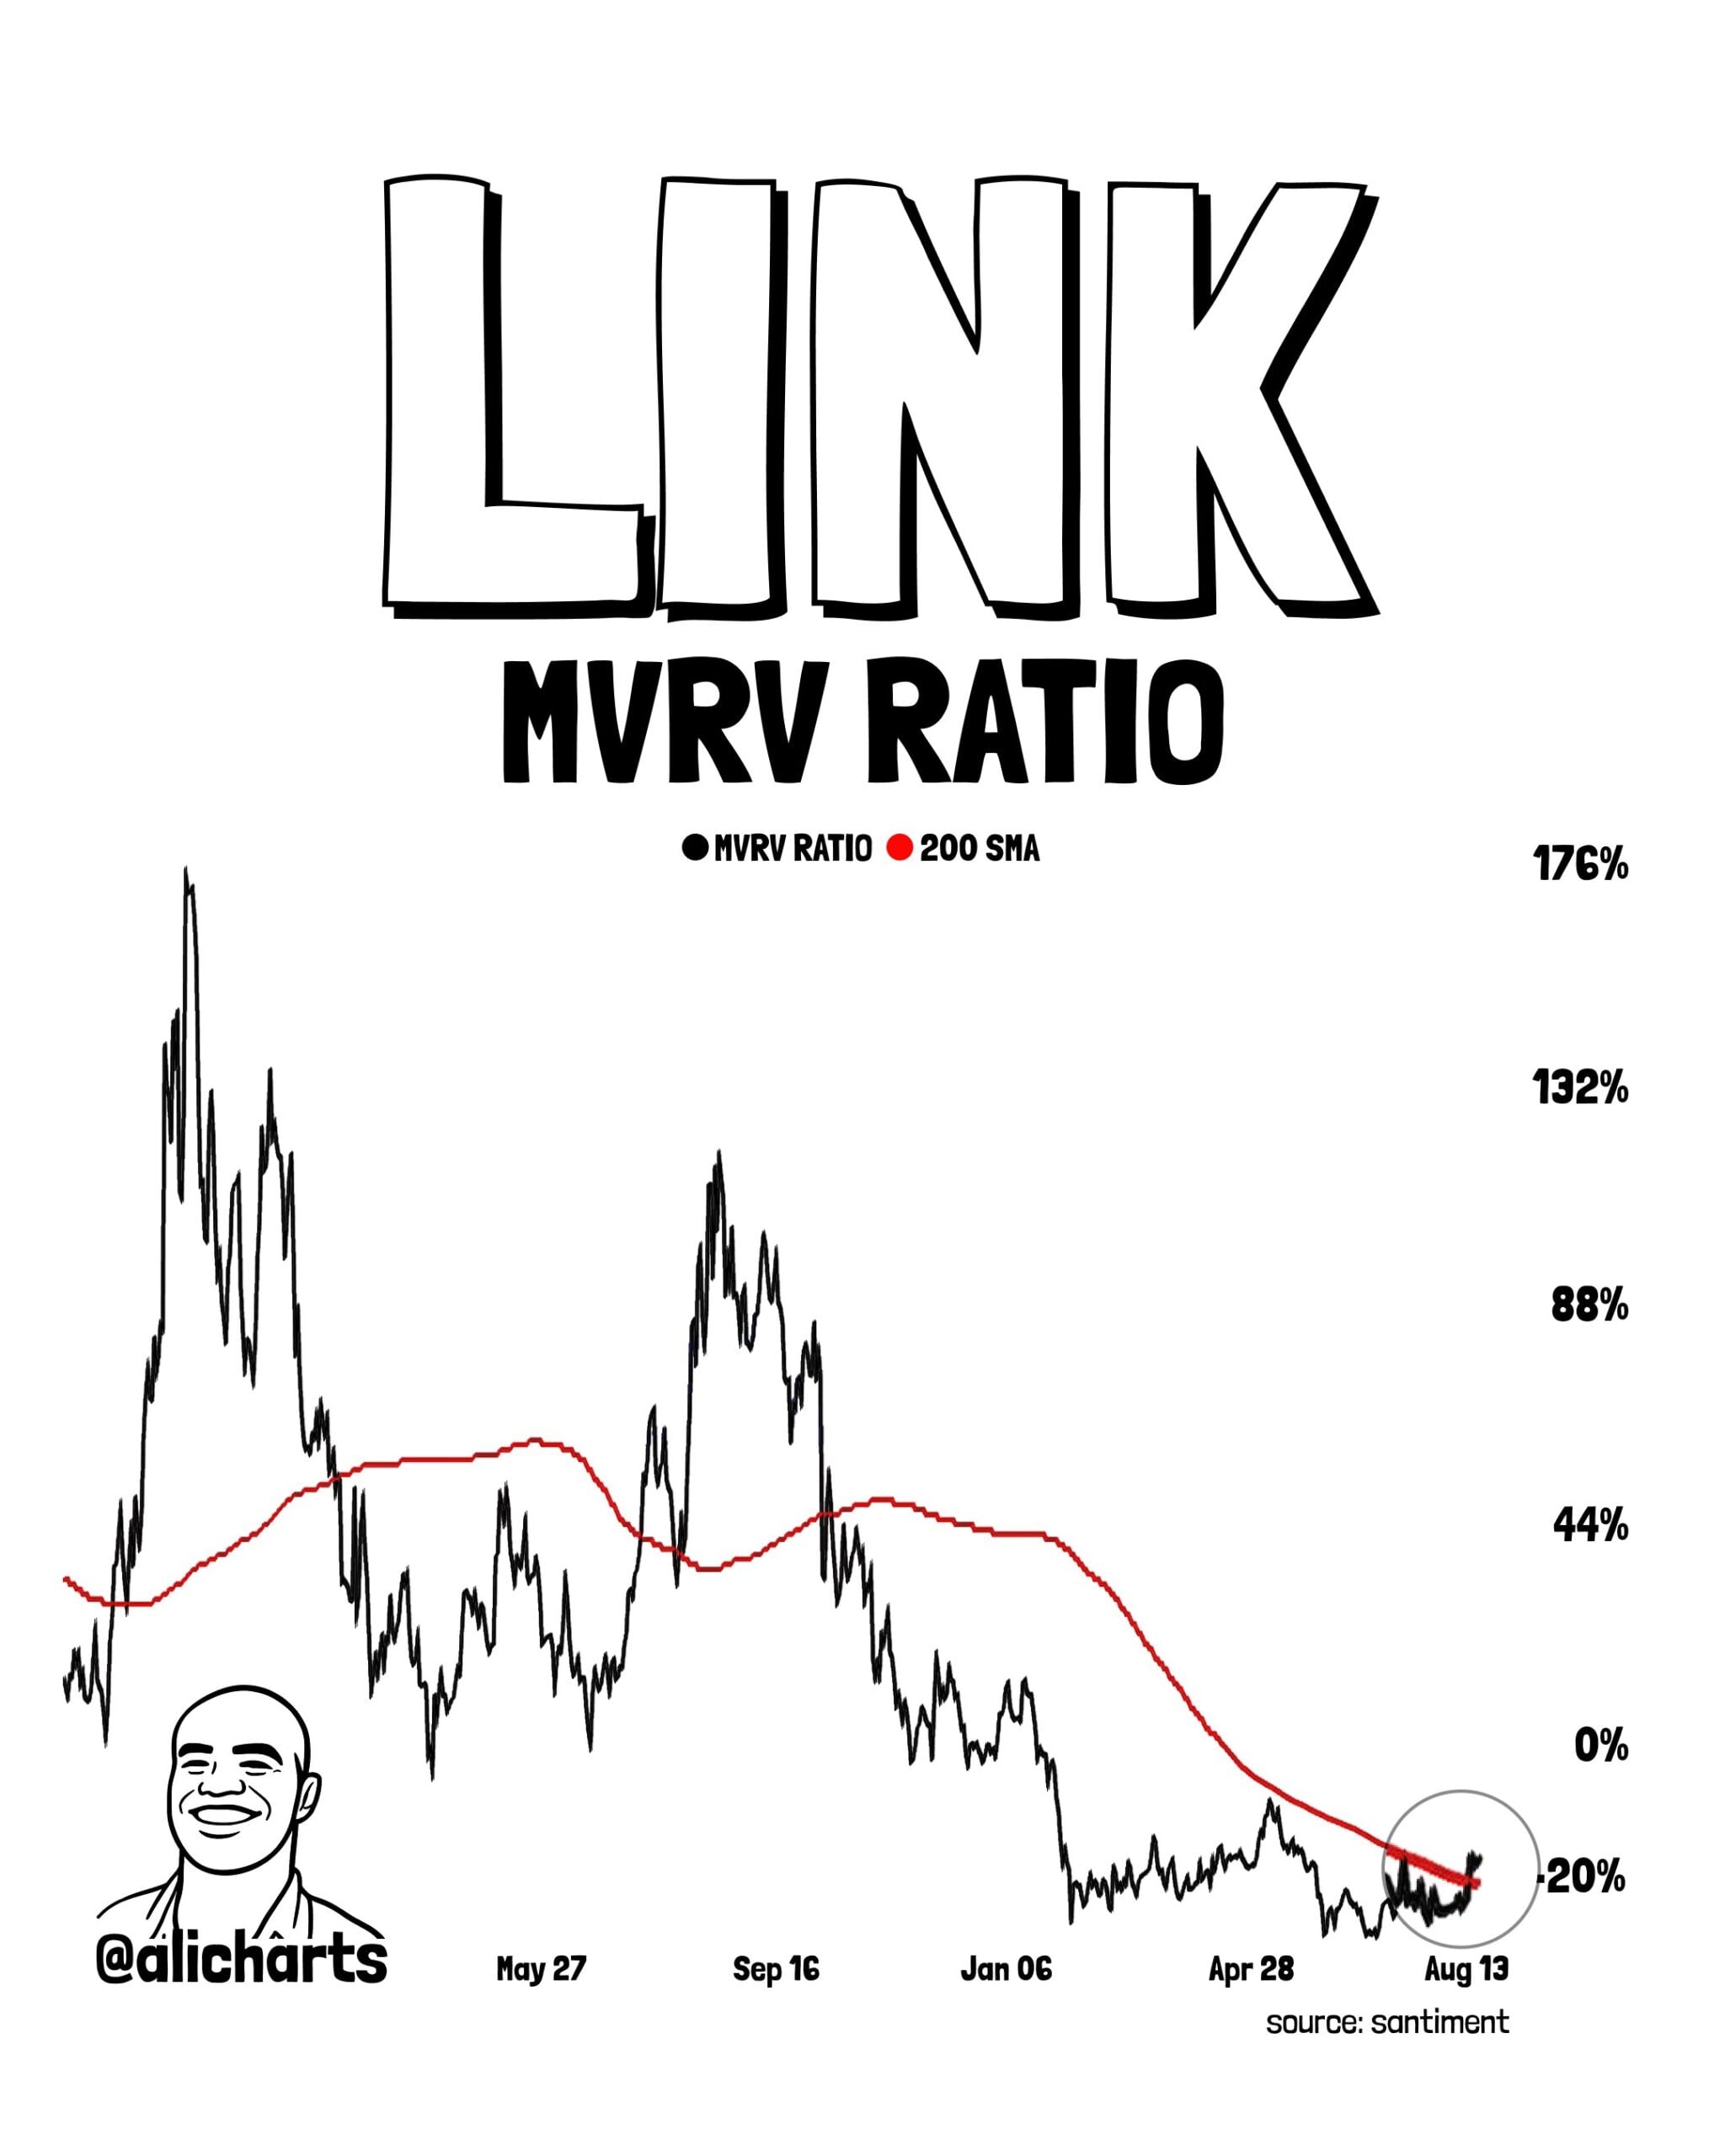
The MVRV ratio has formed a golden cross by moving above its 200-day moving average, the analyst observed. This was the first time in over a year, and has historically been a strong bullish signal.
It resulted in a 155% rally in November 2024 and an 85% move in July 2025.
Apart from this signal, whale activity has increased over the past four days. The TD Sequential gave a buy signal on the monthly chart, too.
Only the $8.80 resistance stands in the way of the bulls.
The path ahead for Chainlink bulls, and why they should remain wary
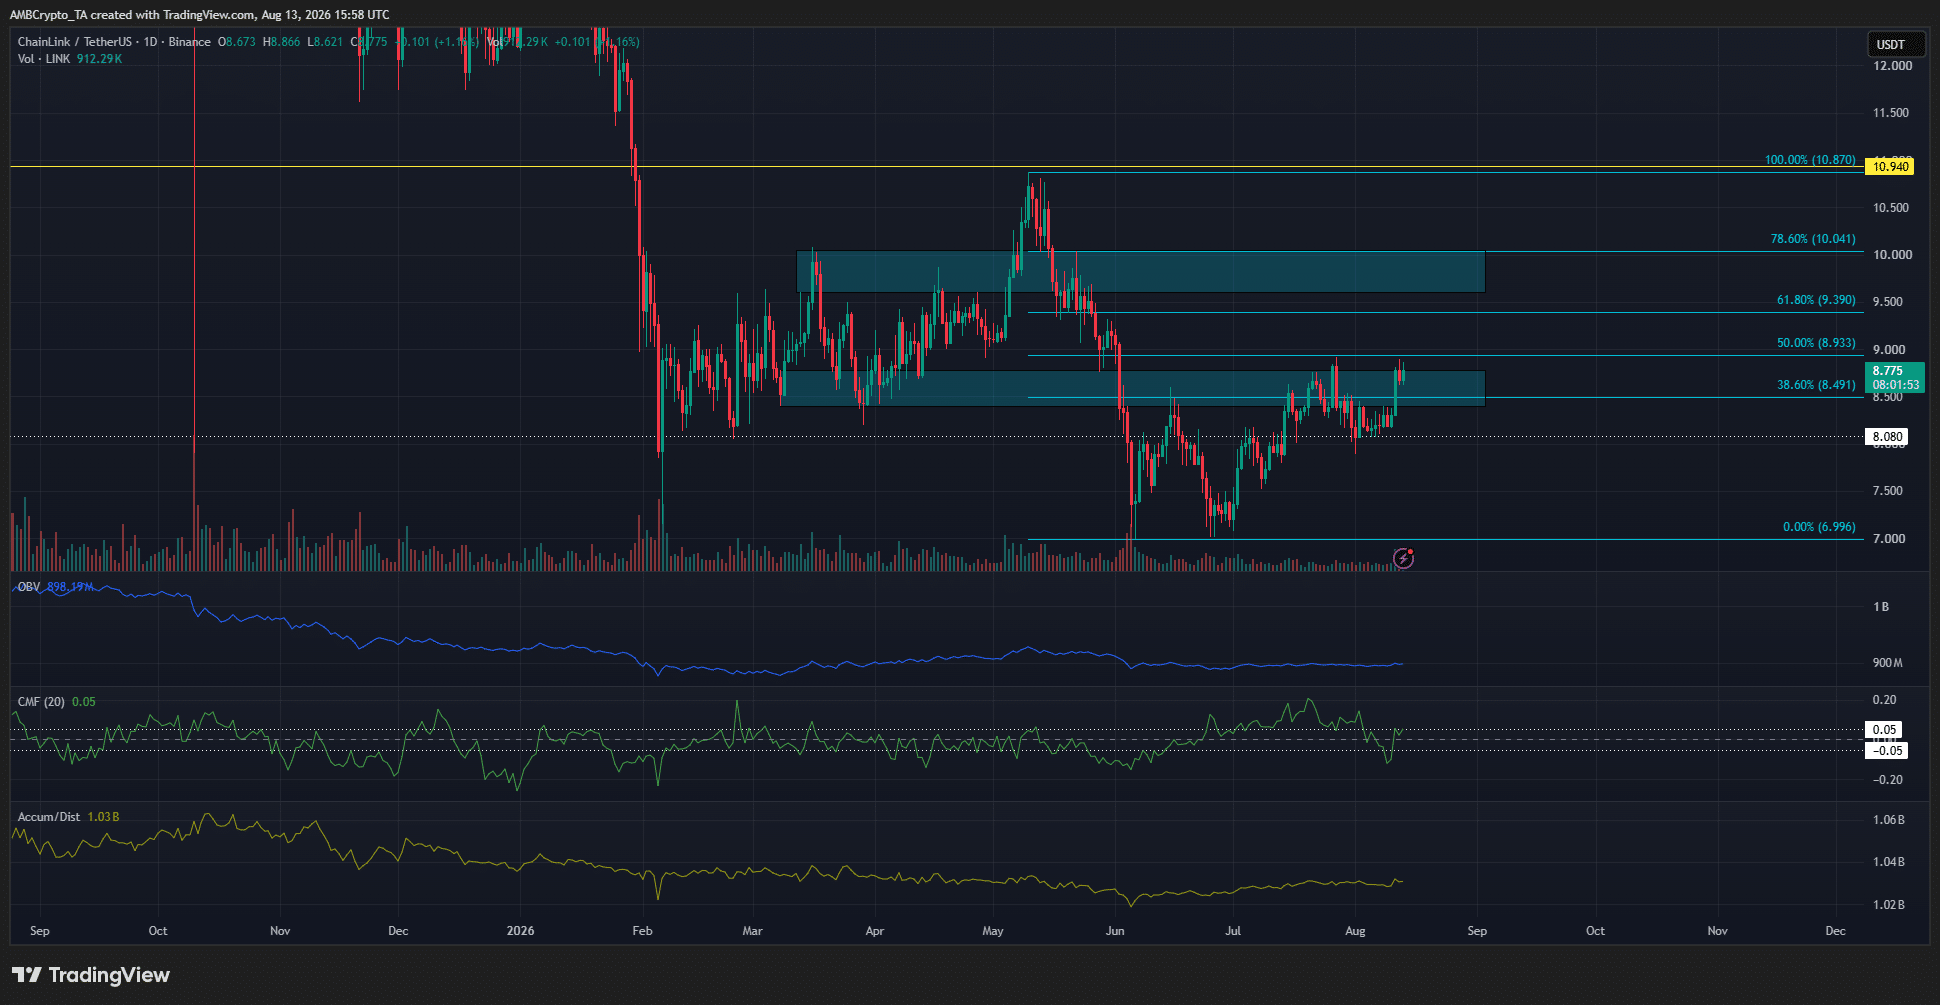
The 1-day price chart of Chainlink remained bearish. The swing structure, captured by the Fibonacci retracement levels, remained in favor of the sellers.
Despite the bullish signals, the volume indicators remained flat. The CMF and OBV were neutral, and the A/D was slowly trending higher. They were not in agreement that strong buying pressure was underway.
The $8.80-$9.00 area and the 78.6% retracement level at $10.04 were key overhead resistance zones. A price move into these two resistances could yield a bearish reaction.
LINK bulls must drive the price beyond the $10.87 swing high to flip the structure bullishly. Until then, sellers will have the advantage.
Final Summary
- The monthly TD Sequential, combined with increased whale activity and the MVRV golden cross, gave a buy signal for Chainlink.
- The 1-day timeframe’s price action has a bearish structure, and the $10 area is a key resistance zone.