Cardano price prediction hints at strong downtrend, but dip buyers may be ready to strike!
Cardano has seen 8 consecutive days of losses, measuring an 11% price slide.



The Dijkstra era planning helped lift Cardano’s [ADA] price bullishly last week. The altcoin made a bullish structure break on 6th August. However, it soon slipped into a retracement phase.
The past eight days of trading have been red, and the token has shed 11.2% of its value since the open at $0.201 on Friday, 7th August. Importantly for the lower timeframe traders, the $0.185-$0.190 local support zone has been ceded to the bears.
Buyers would have hoped that the bullish structure and the Dijkstra era impetus could push Cardano’s price higher. Alas, it was not to be. Here’s how deep the retracement can go and where the next buying opportunity would be.
Cardano inches closer to a value area for buyers
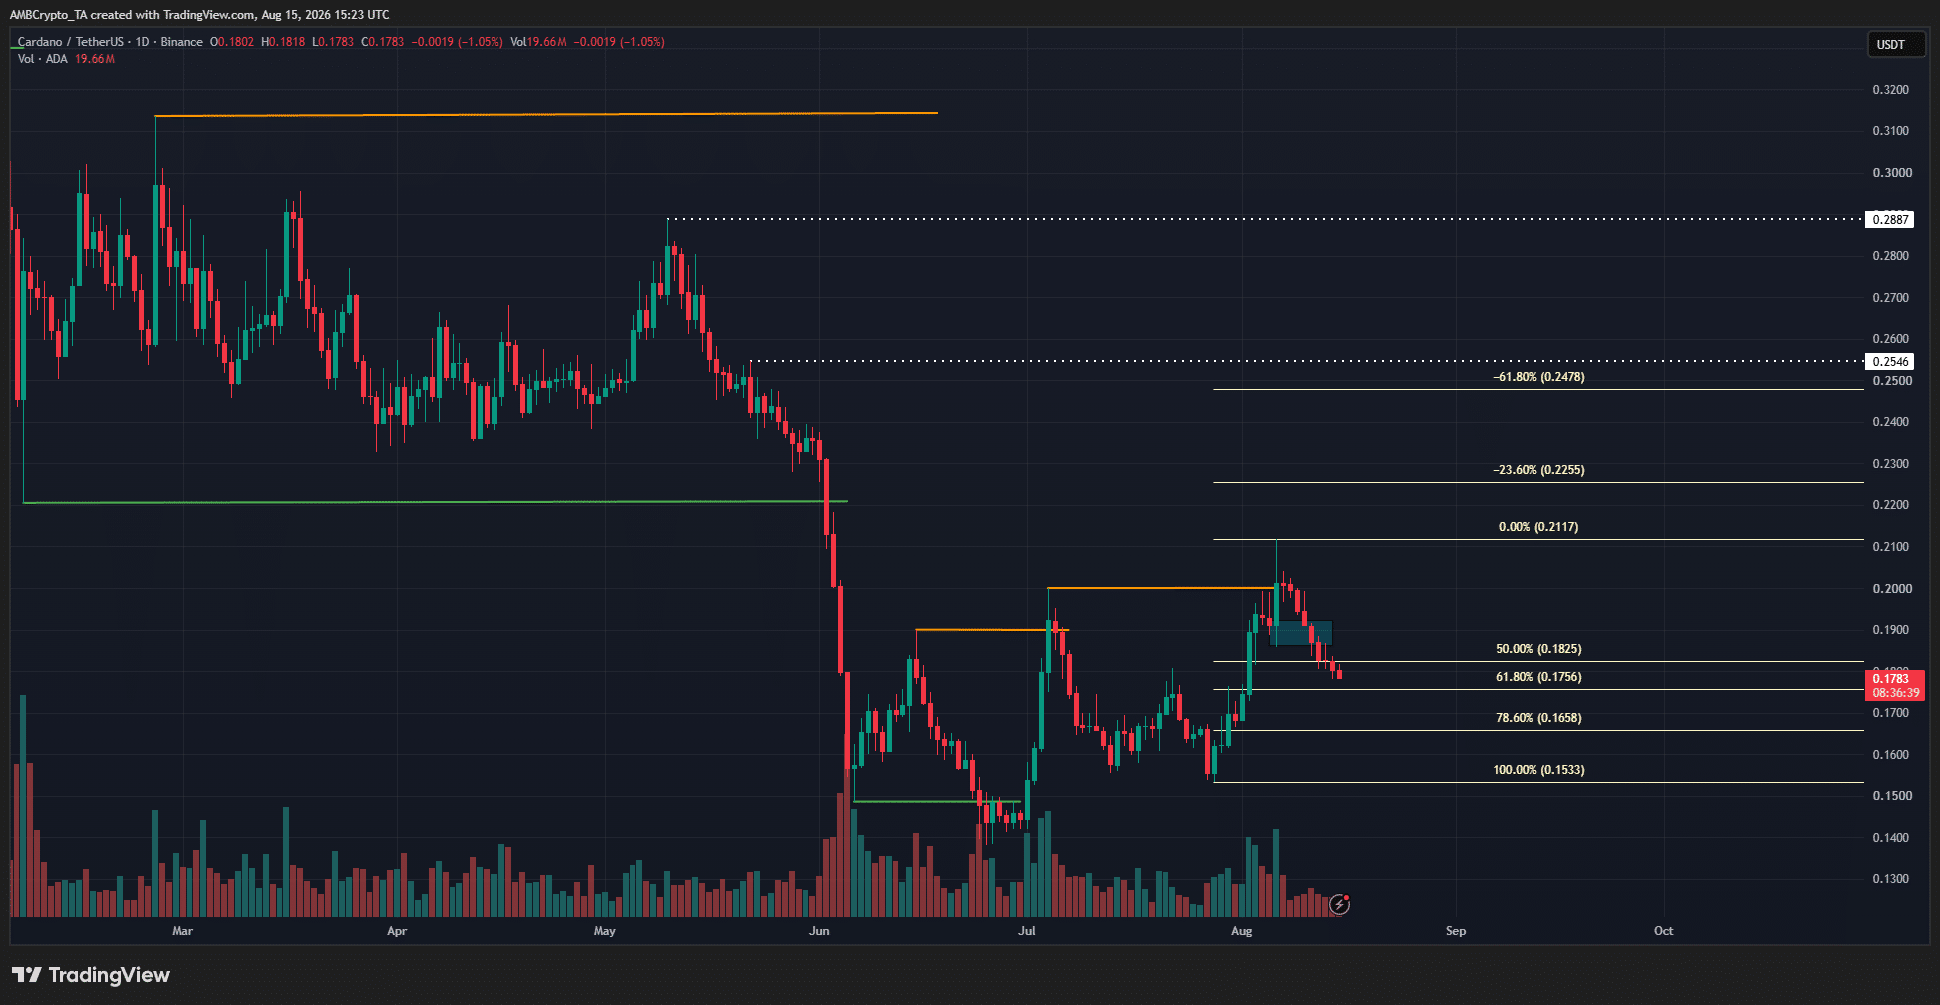
The swing structure remained bullish, and another swing high at $0.211 was set recently. The 1-day timeframe price action made it clear that the recent losses were part of a retracement.
The Fibonacci retracement levels (pale yellow) highlighted the $0.165-$0.175 area as the golden pocket, between the 78.6% and 61.8% retracement levels.
Cardano‘s price was already below the 50% level, within a discount area. A growing discount would make ADA a better buying opportunity for swing traders.
So long as a daily trading session does not close below $0.153, a move back above $0.211 can be anticipated.
Traders’ call to action – Wait to buy
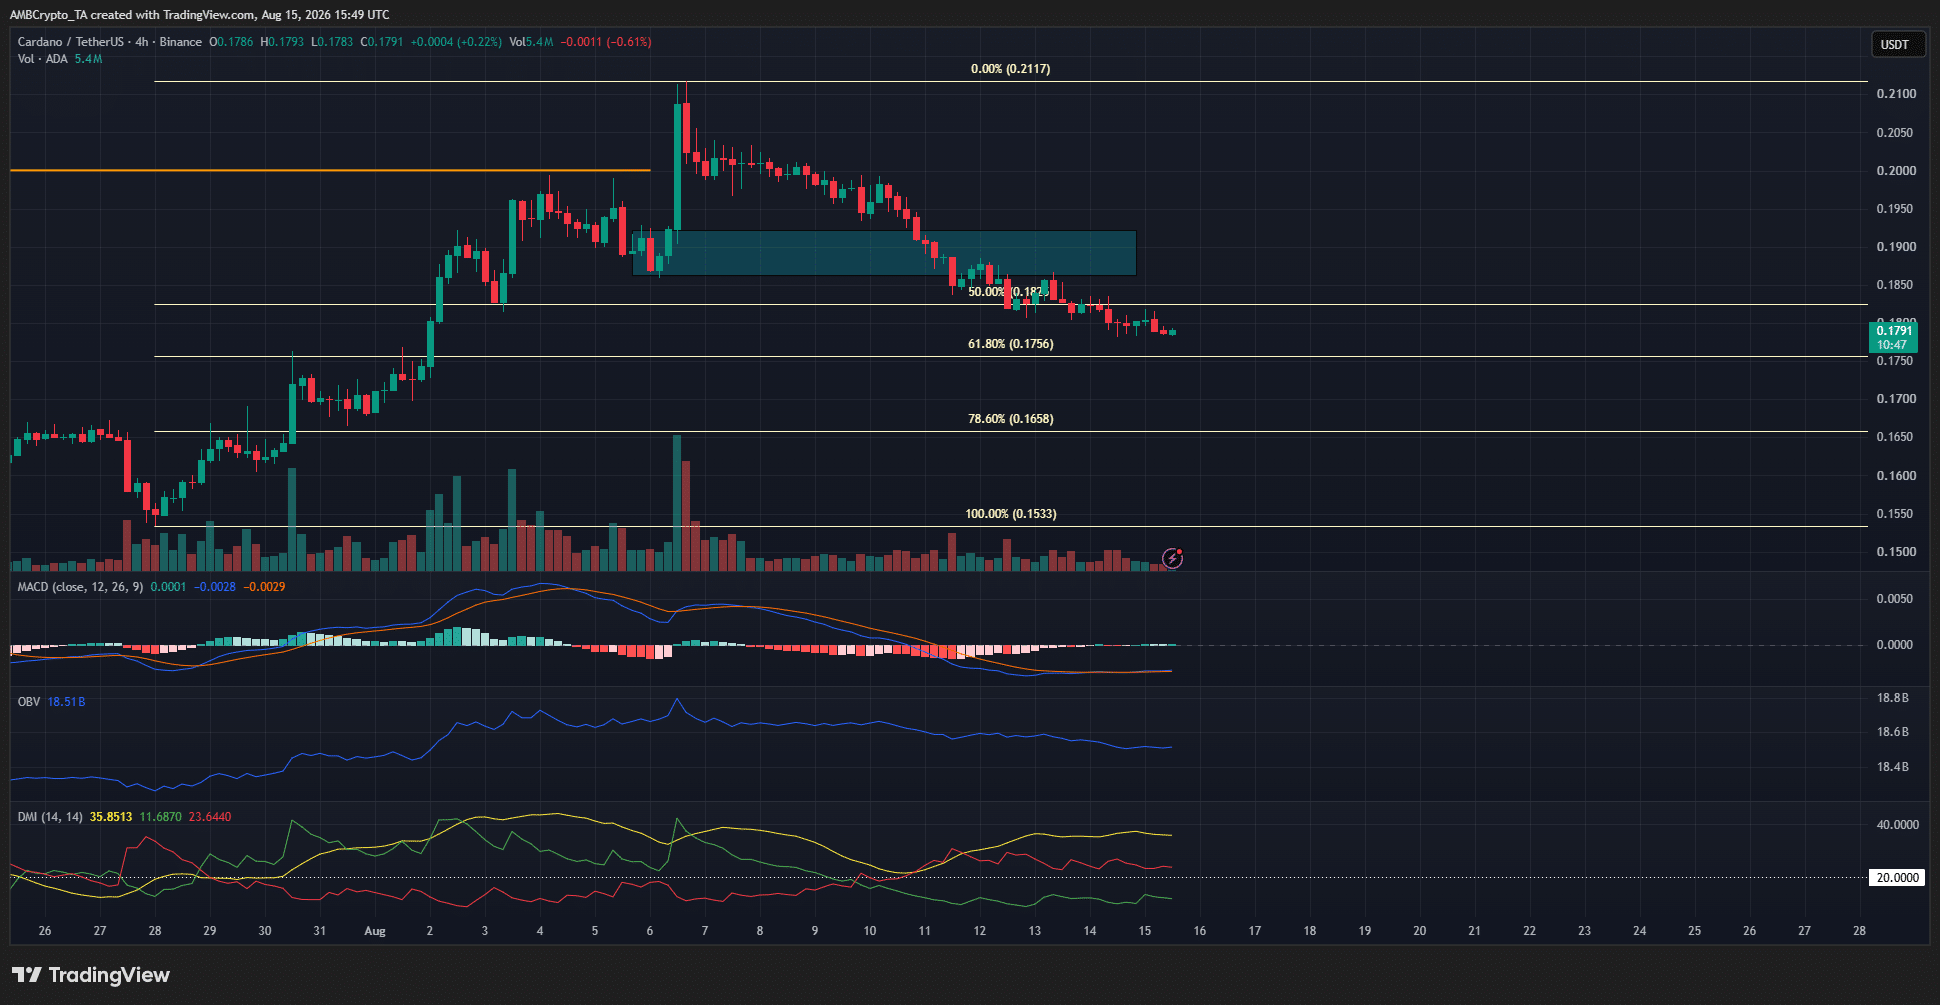
At press time, the 4-hour timeframe’s technical indicators were firmly bearish. The OBV has been in decline over the last eight days, with the MACD well below the zero line to show sustained bearish momentum.
The DMI also showed a strong downtrend in progress, with both the ADX (yellow) and the -DI (red) above 20.
And yet, as the structure revealed, this downtrend on the 4-hour timeframe might only be a retracement phase.
Therefore, swing traders can wait for the key Fibonacci retracement levels to be tested. An uptick in trading volume and buying pressure would tell swing traders that the retracement phase is ending.
This would look like a turnaround in the OBV and aforementioned average trading volumes. Like when we saw Cardano trending higher towards $0.211 near the end of July.
Final Summary
- Cardano has seen 8 consecutive days of losses, measuring an 11% price slide.
- Short-term downtrend only part of a retracement, and buyers are likely waiting to enter the market in the coming days.