Will Zora crypto break $0.0121 resistance? Watch out for THIS major signal
ZORA broke a year-long pattern, but one rally cannot erase a market’s memory.



Zora [ZORA] fell 1.51% in 24 hours, but swing traders and investors have reason to adopt a bullish bias. The $34.2 million altcoin gained 27% over seven days and traded 37% above its month-ago price.
Zora’s Base App integration allows creators to monetize their posts. However, Trading Volume dropped 46% over 24 hours as ZORA retraced approximately 36% within three days.
Did the decline signal fading demand, or was the market retesting Zora’s breakout?
The 160% August rally has shifted Zora crypto trends
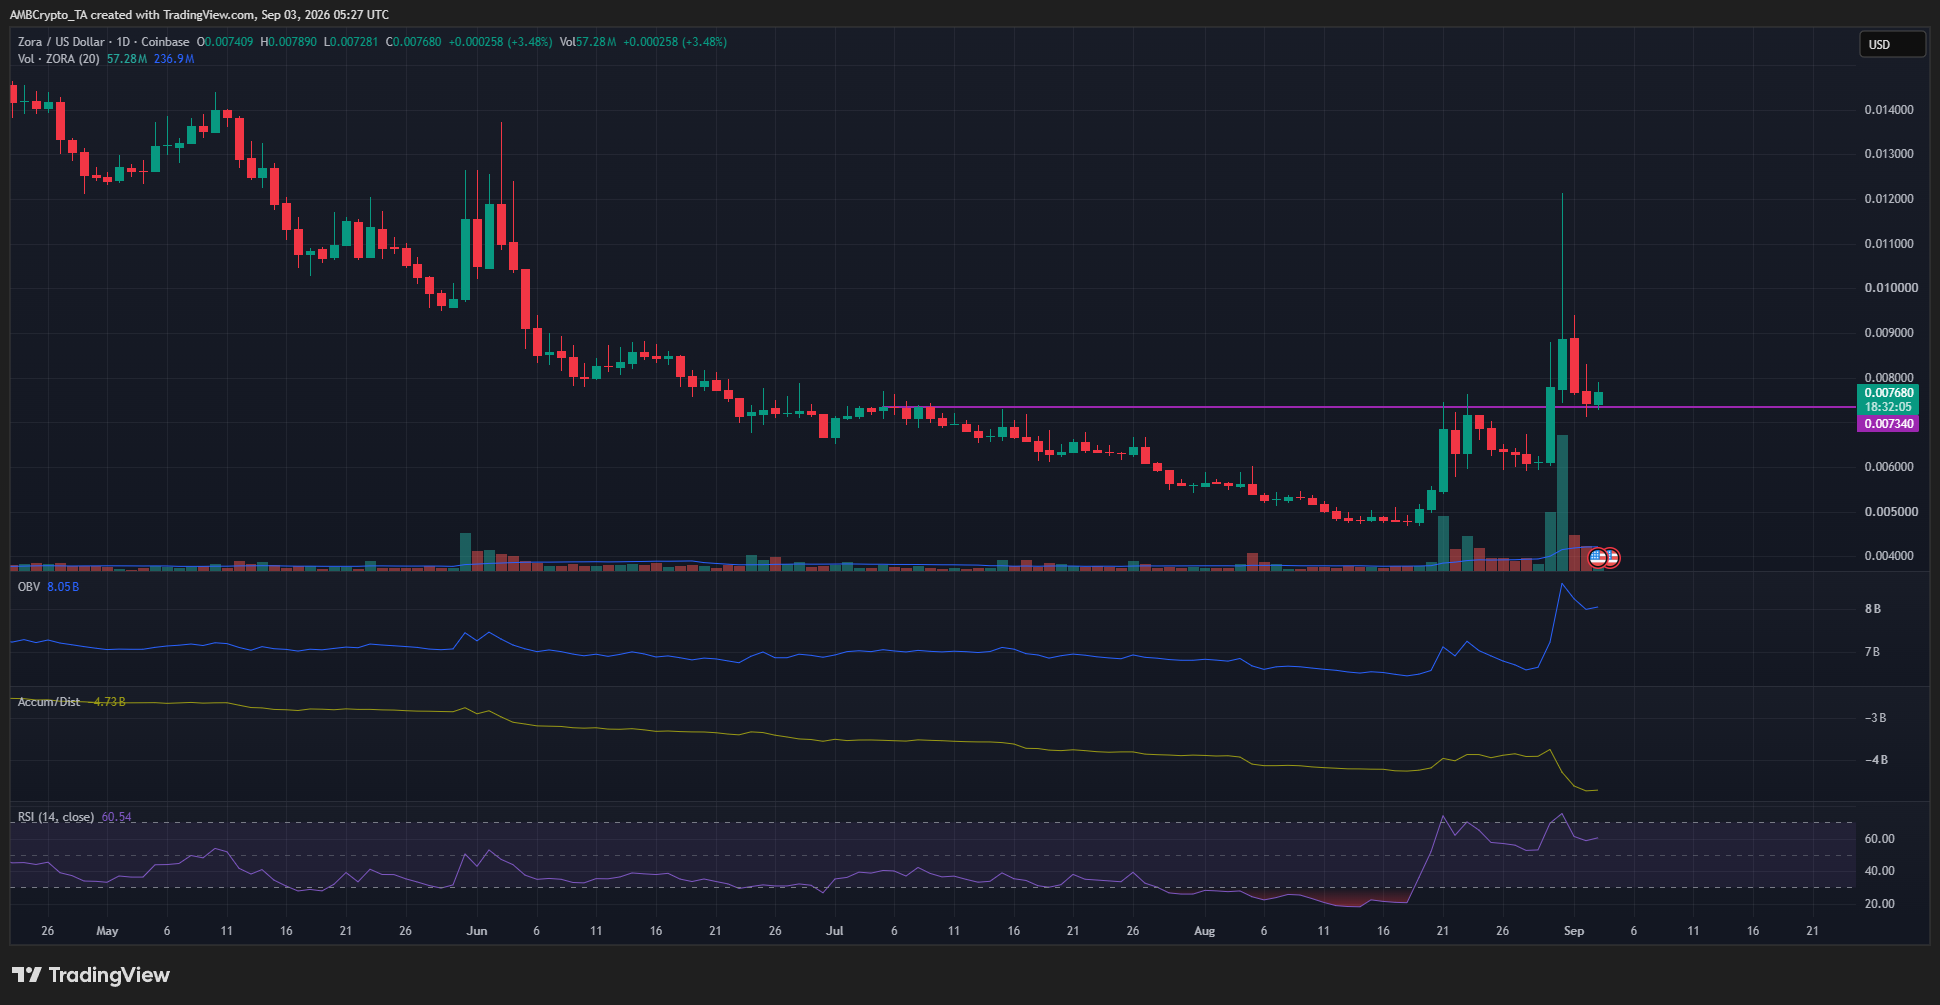
For a year now, Zora crypto has operated within a bearish trend on the 1-day timeframe. Since June, the token has been sliding lower with very few sizeable price bounces, till the one in August.
Using the 1-day timeframe, a lower high (purple) at $0.007 was identified as the latest swing high that kept the bear trend alive.
The latest rally took prices to $0.0121, well past the previous swing high. This move marked a bullish structure shift.
Interestingly, the OBV made new highs and was trending higher while the A/D indicator fell lower. This was a result of how the indicators are calculated and not a divergence. The large upward wick was what caused the A/D indicator’s decline.
Traders’ call to action: Buy
Swing traders and investors need not be worried by the A/D indicator’s readings. The defense of the $0.007 support zone in recent trading hours was a positive outcome.
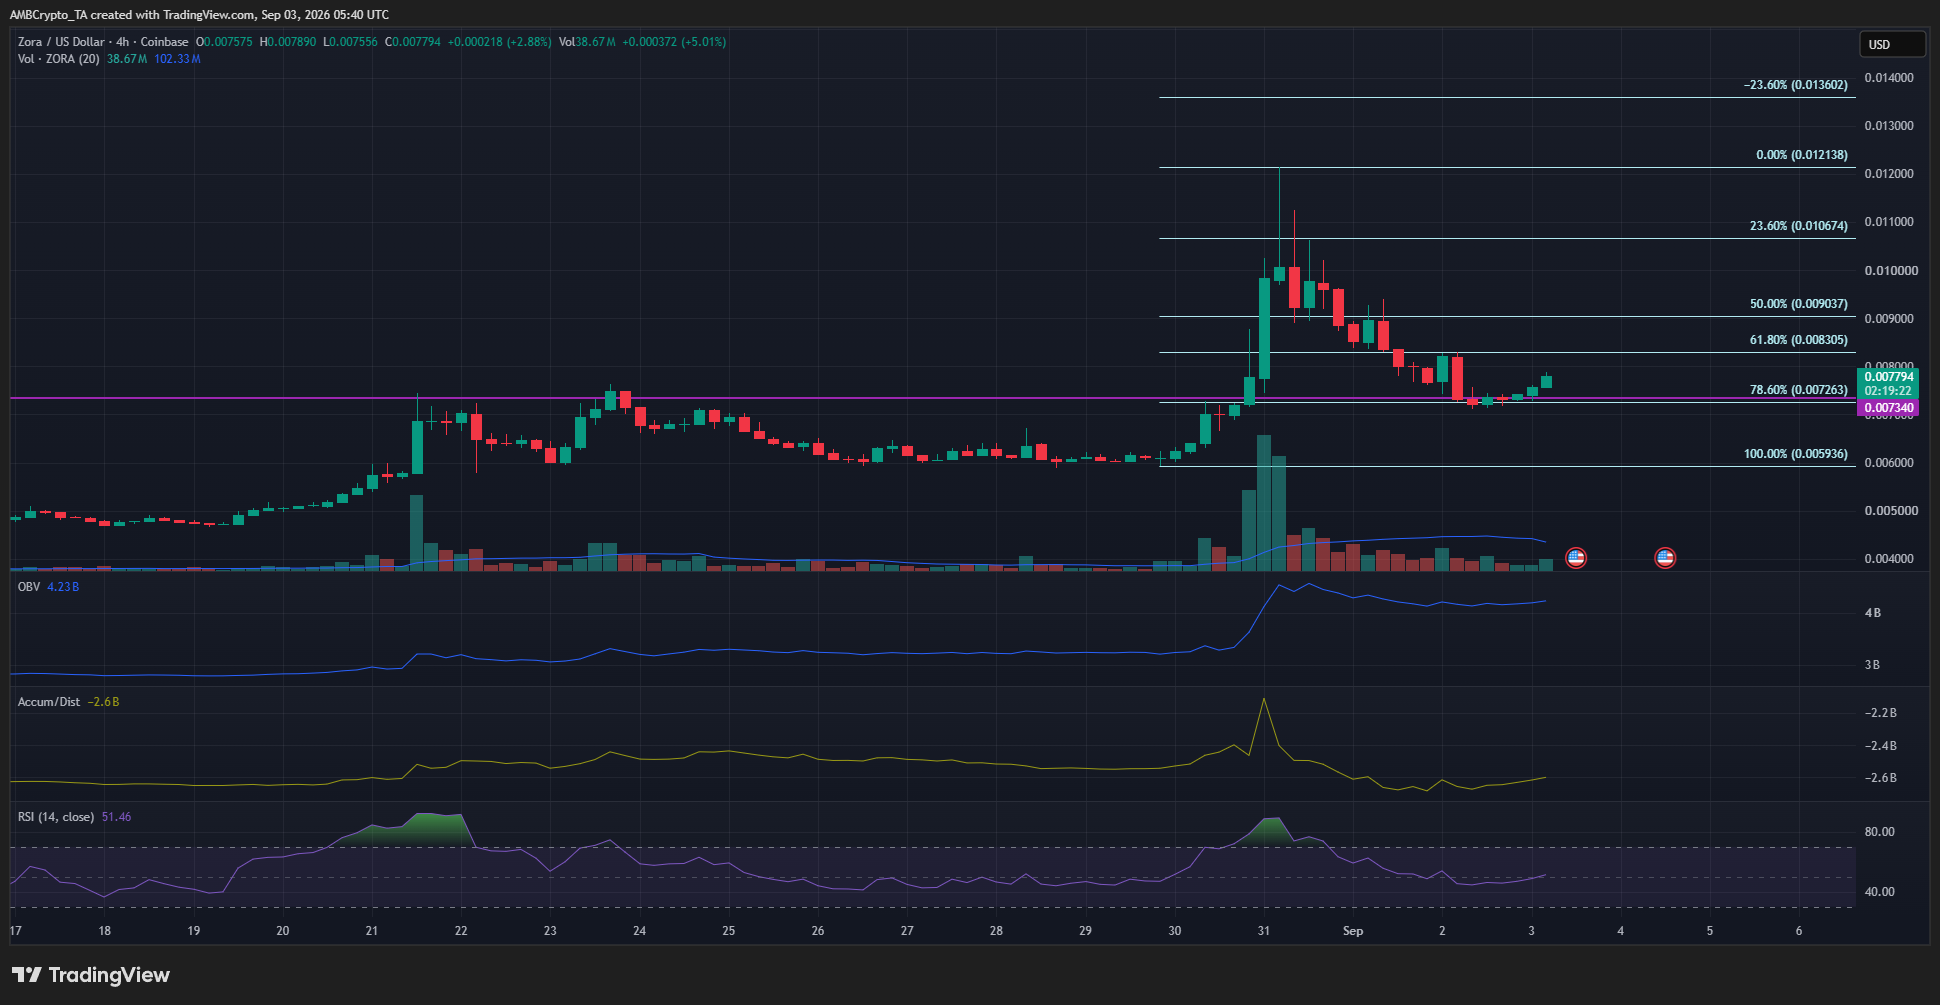
The 4-hour chart’s swing structure was plotted. The rally from $0.0059-$0.0121 marked the latest swing move higher. A set of Fibonacci retracement levels was plotted.
The 78.6% retracement level at $0.0072 became the key support to watch, especially since it had confluence with previous resistance zones.
It is likely that ZORA would continue its rally and move toward $0.0121 and $0.0136, the 23.6% northward extension.
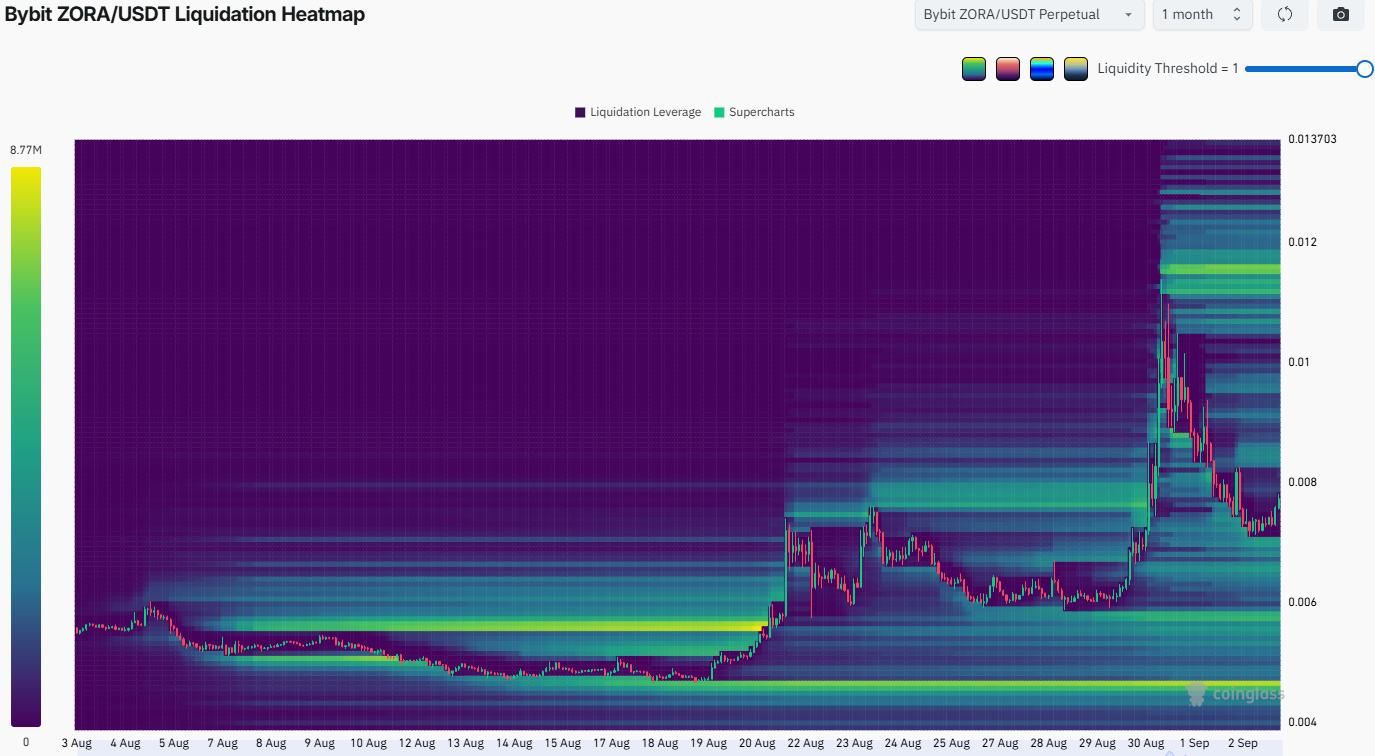
The Liquidation Heatmap showed a cluster of short liquidations near $0.0085.
A move through that pocket could accelerate price toward $0.0121, although liquidity does not guarantee direction.
Based on the combined structure, ZORA presented a potential buying opportunity with clearly defined risk. A fall below $0.0059 would invalidate the bullish setup.
ZORA has repaired its structure. Now it must prove the rebound has buyers beyond the first bounce.
Final Summary
- Zora crypto has rallied swiftly over the past month, but has been retracing its gains since the 31st of August.
- That retracement would likely end soon. The buyers have defended a key Fibonacci retracement level and support zone.