Assessing Cash Cat’s 29% rally as liquidations hit $611K: What’s next?
CASHCAT makes new peak amid Robinhood Chain's memecoin gold rush.



Cash Cat [CASHCAT] is leading the memecoin sector by daily gains of more than 29%, resulting in a new peak of $0.30. The coin is the second largest by market cap on the Robinhood Chain, behind PONS [PONS].
CASHCAT is the unofficial cat meme named after Robinhood’s discarded CashCat brand. This raises the question: why is the memecoin continuously making new highs?
Robinhood’s memecoin gold rush—CASHCAT leads
The memecoin is driven by Robinhood Chain’s memecoin gold rush, sparking high trading activity.
This frenzy is evident as the top three coins on the Robinhood DEX, that is, PONS, CASHCAT, and AI, have market caps exceeding $280 million. Each of them outweighs the fourth-ranked coin, STONKBROKER, by over 8x.
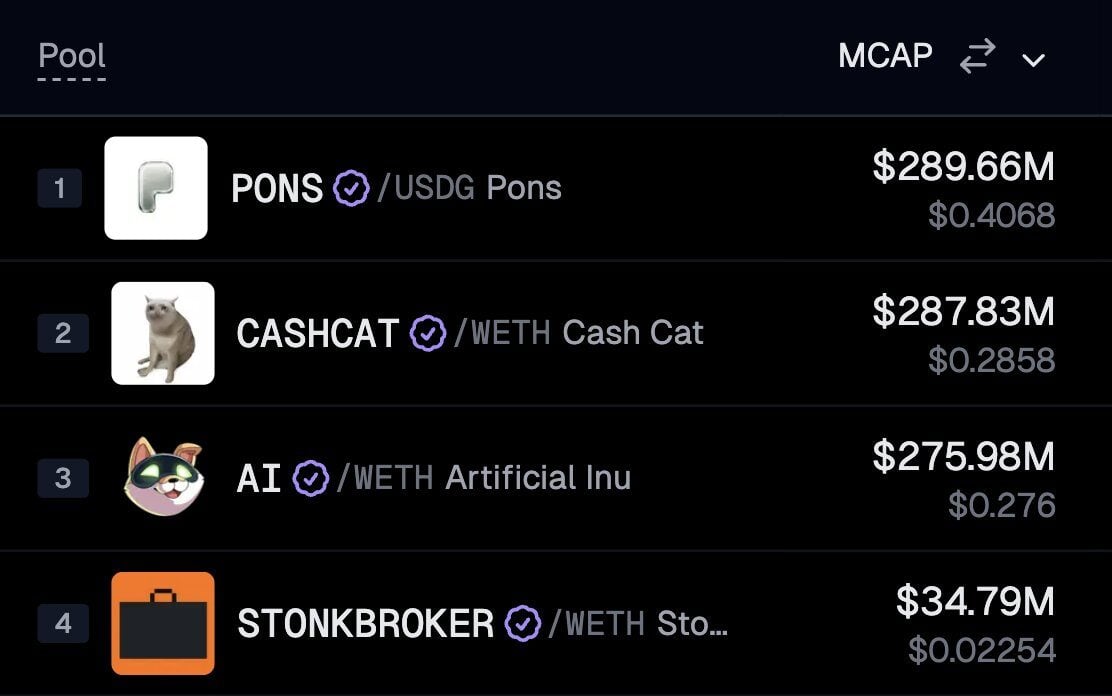
Moreover, Cash Cat is drawing liquidity from other cat-themed memecoins on other chains, such as BASECAT, which has a market cap of only $25 million. The Base Chain’s meme is more than 10 times smaller than CASHCAT’s $287 million.
It has also outpaced OG cat memes like POPCAT, whose market cap is at $49 million.
Apart from the hypon Robinhood fueling the memecoin, short liquidations over the past 24 hours have amplified the gains.
Over $377K in short orders was wiped out in under an hour. In total, more than $611K in short positions had been liquidated with a few hours left to close the day.
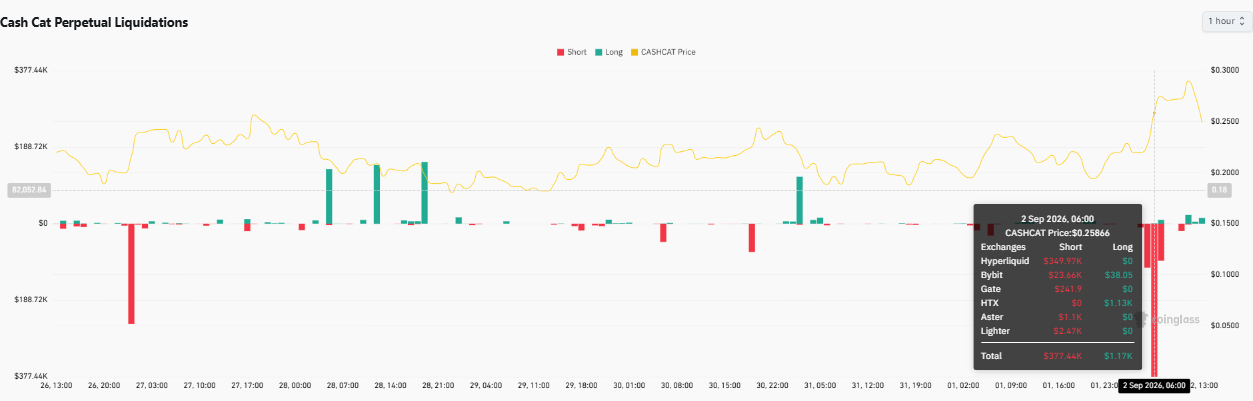
While the memecoin extended its weekly gains to over 40%, bulls appeared steady.
Can bulls keep CASHCAT above the previous peak?
Overlying the price of the memecoin on a 4-hour chart showed a clear uptrend pattern. The new peak came after a week of consolidation between $0.17 and the previous high of $0.2592.
A consolidation around highs with sufficient momentum often hints at continuation. Now, CASHCAT is testing the broken high, and if bulls keep it above this level, a new high may be formed again.
Otherwise, a breakdown may prompt a bigger correction. The coin’s next demand zone is at the $0.217-$0.225 zone, defined by the MA Cross indicator for the 20-day and 50-day MAs.
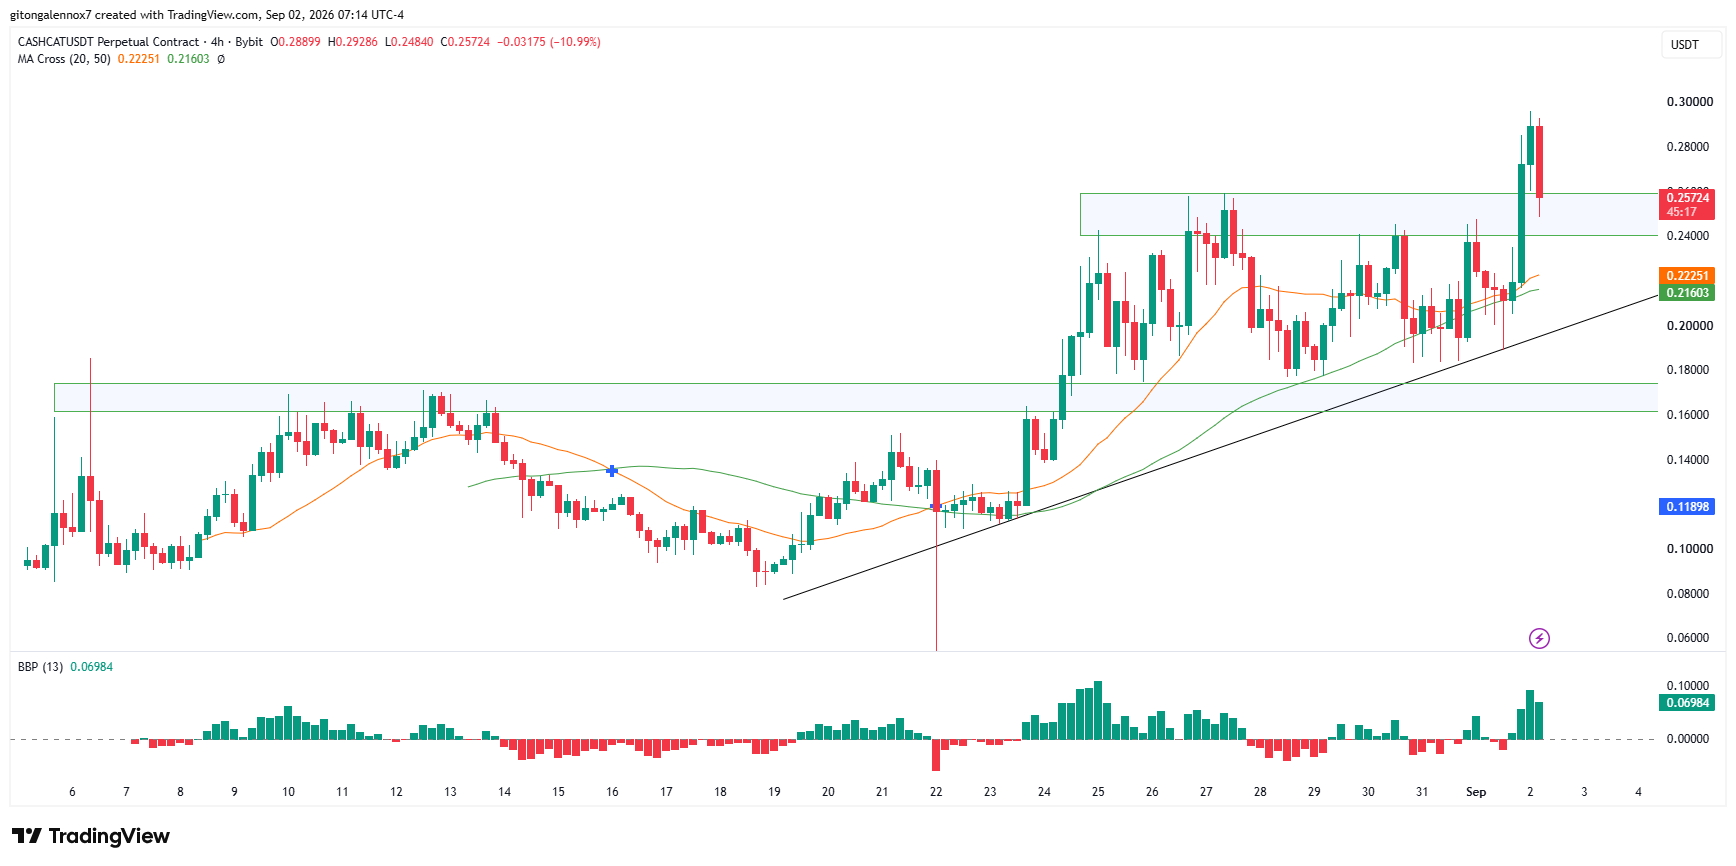
However, the trendline and horizontal support at $0.17 may act as more resilient support levels than those from MAs. Thus, the price might drop to these zones, but losing $0.17 may shift the market structure to bearish.
Interestingly, during the two recent sessions when candles were red, the bars of the Bull Bear Power (BBP) remained green. This reading reinforced that bulls were still present.
Final Summary
- CASHCAT rallies 29% in 24 hours, setting a new all-time high amid Robinhood Chain’s spike in trading activity.
- CASHCAT’s bulls held on to the coin’s strength with the last area of their defense against bearish control at $0.16.