Polkadot: Assessing if ETF and network activity can carry DOT to $1.30
How network activity, capital inflow via treasury and ETFs fuel Polkadot's rally.



Polkadot [DOT] is up by more than 13% in the past 24 hours. Similarly, the total crypto market is rallying as short liquidations increased by 17% to around $272 million.
But DOT’s surge is not only dependent on the broader crypto market strength. High network activity, capital inflows through treasury and ETFs, and a bullish technical outlook have been key.
Why is Polkadot surging?
Looking at the network activity, Polkadot‘s Monthly Active Addresses have doubled in September. The number has grown from 40K in August to a high of 82.9K, but the figures have since retraced to 80.3K.
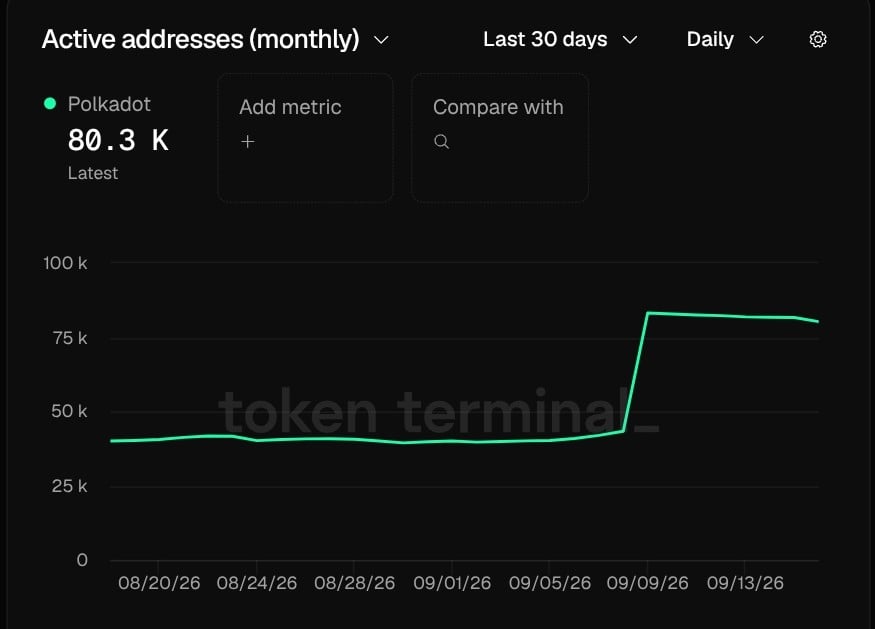
Moreover, the monthly token trading volume has increased by 116%, hitting $4.70 billion.
Transactions have also continued to stay high, aligning with the past analysis. Daily transactions are averaging 238K, with the sum for the past 30 days at 7.20 million, as per Token Terminal.
In terms of capital flow, it turned positive this month on an overall scale.
For instance, 21Shares Polkadot ETF [TDOT] saw net inflows of $663K after two months of dormancy, as per SoSoValue. This indicated institutions were gradually returning to buying TDOT, which could be accelerated by the SEC’s regulatory clarity on tokenization.
Additionally, Treasury net flows turned positive after staying negative for 5 days this week. In the past 24 hours, net flows surpassed $2.04 million, 10 times bigger than the other positive day of the week.
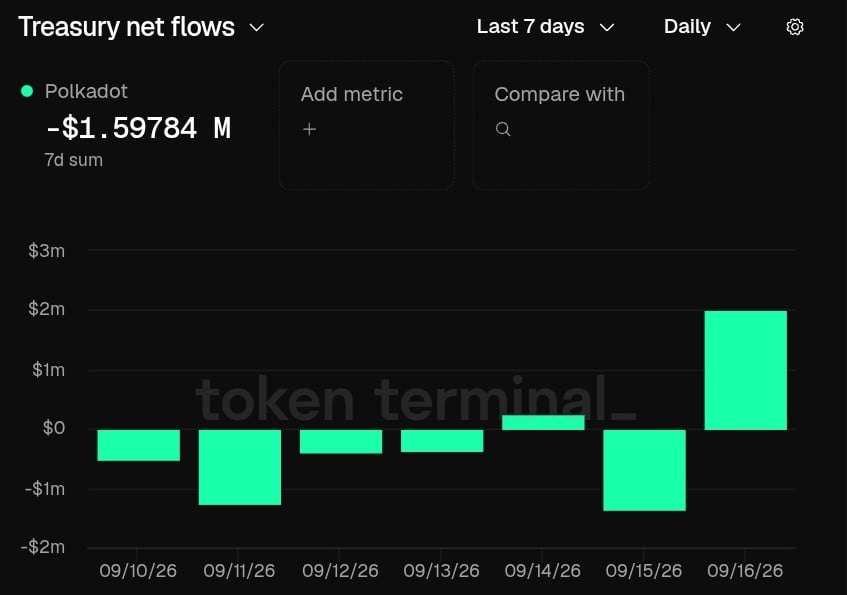
Still, the weekly treasury net flows remain negative, at around $1.59 million.
Can bulls flip $1.30 into support?
Technically, Polkadot was respecting a rising trendline support on the daily timeframe. The price had bounced off the support for the third time and the altcoin appeared to be headed toward $1.30.
The Bollinger Bands (BB) were expanding, indicating volatility was increasing. Additionally, the Stochastic RSI with a reading of 30 was rebounding from the oversold territory. This hinted at seller exhaustion.
Flipping the $1.30-$1.44 zone into support would expose $1.70 and levels above $2.
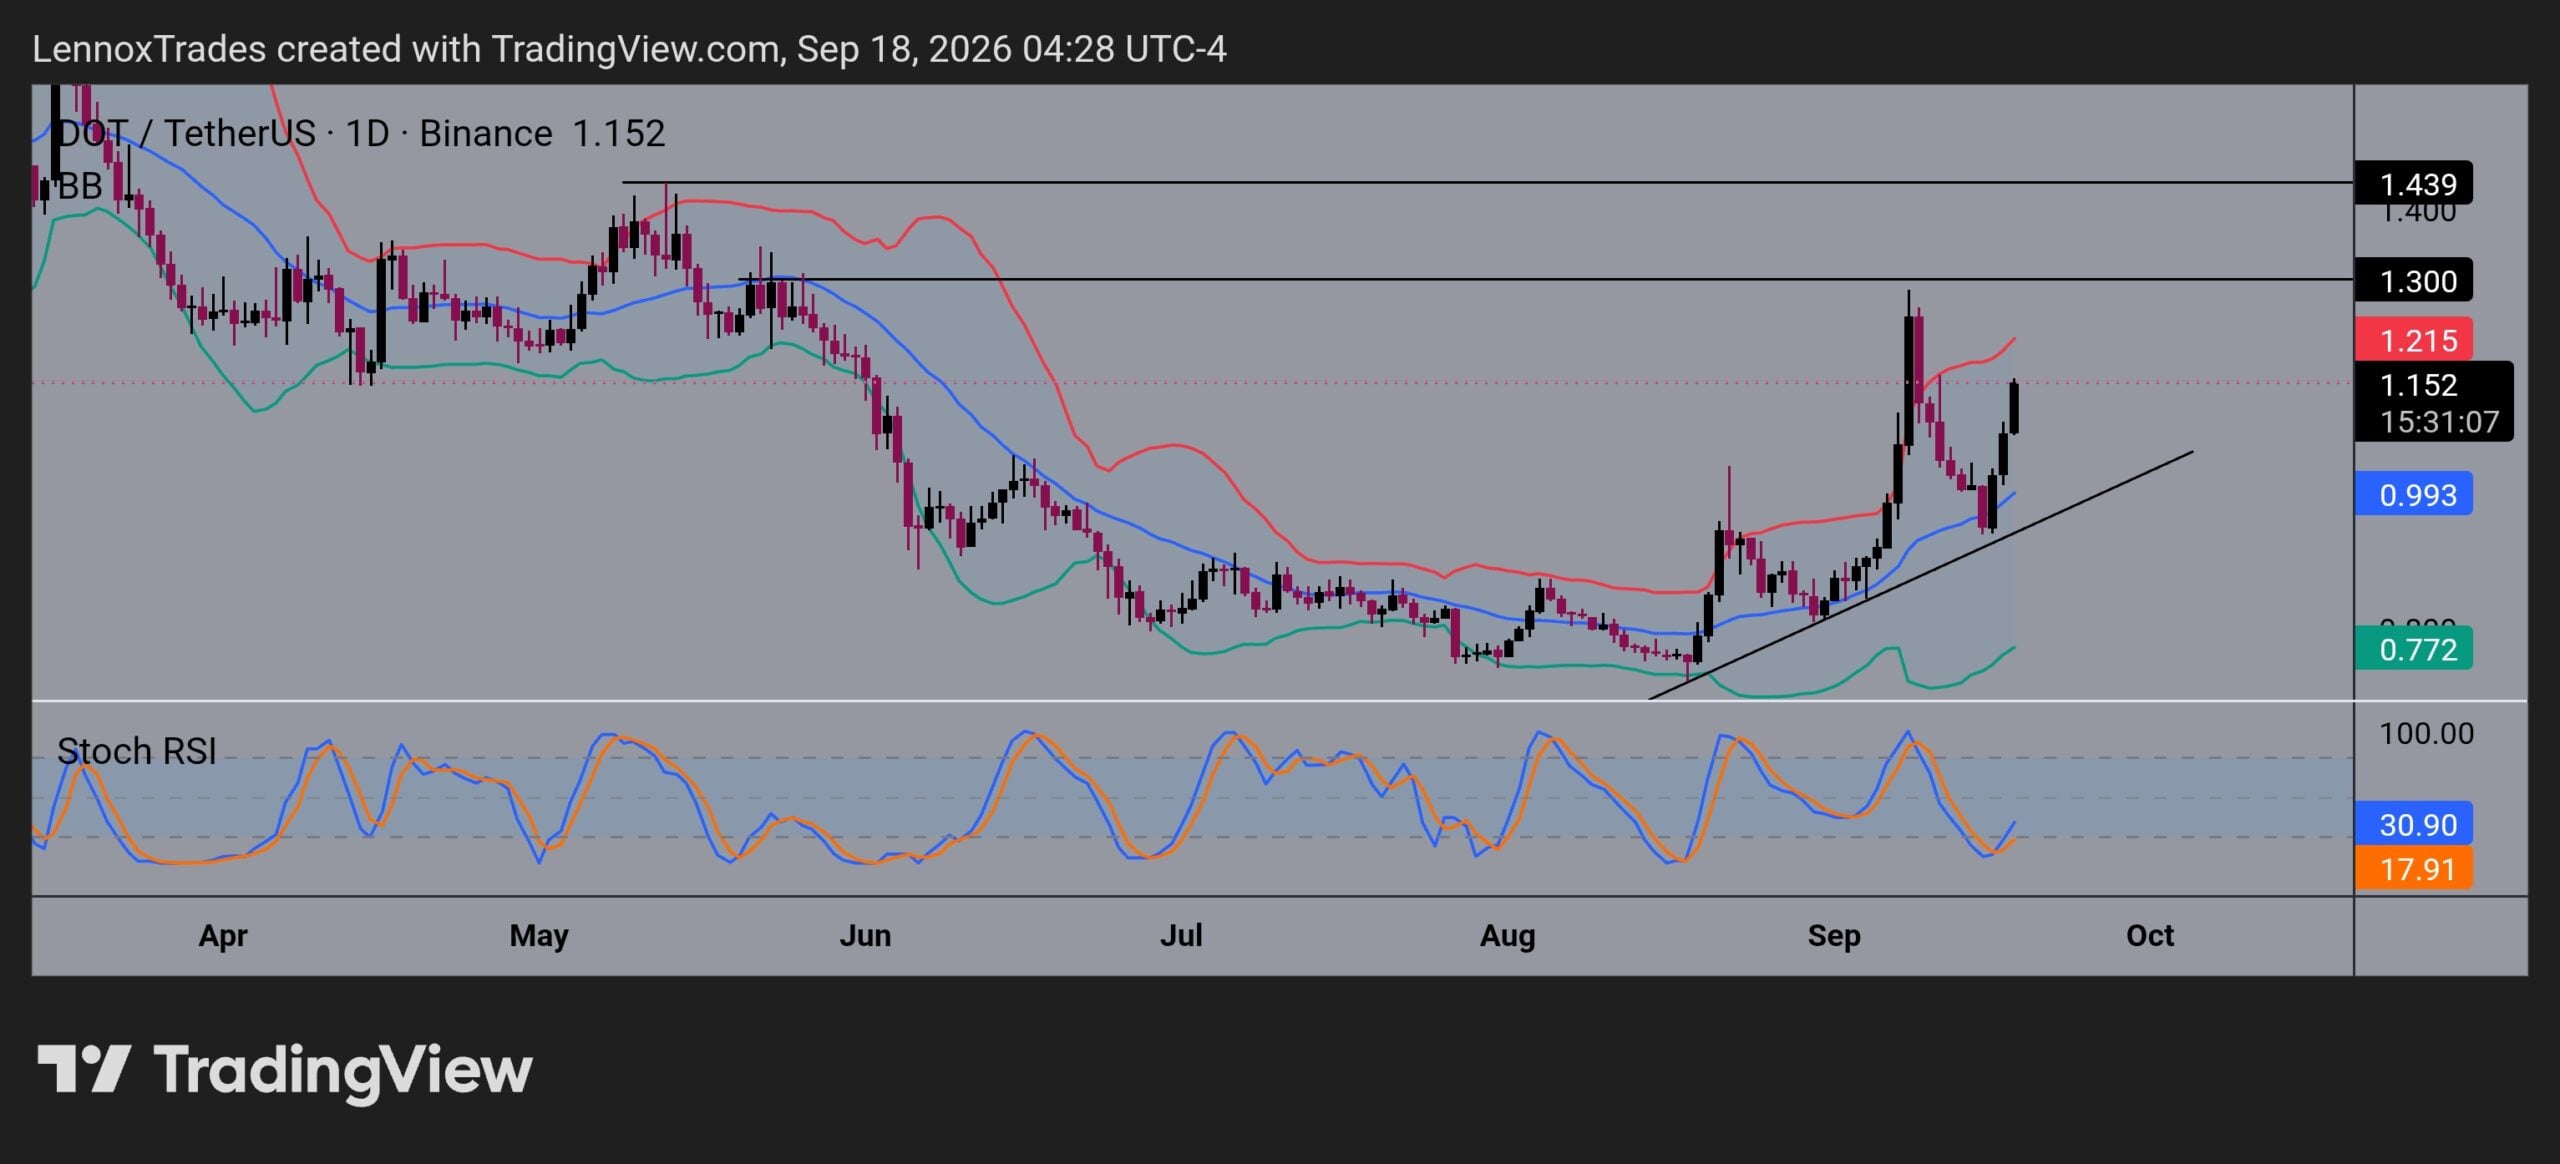
On the other hand, a breakdown of the slanting trendline would invalidate the uptrend, especially losing $0.945 as horizontal support. This $0.945 level was the previous higher high (HH) in the ongoing uptrend.
Therefore, the market structure of Polkadot remains bullish unless the current pattern of HH and higher lows (HL) is lost.
Final Summary
- Polkadot surged over 13% in the past 24 hours, amid high network activity, capital inflows and a bullish outlook.
- DOT price is respecting a rising trendline supporting further appreciation unless the price breaks below it.