Pump.fun: Why PUMP’s 20% surge faces KEY test despite $466M buybacks
Pump.fun’s buybacks strengthened PUMP’s supply narrative as price corrected from the $0.005287 resistance.



Pump.fun [PUMP] recorded a rapid increase in platform activity as new token launches climbed more than 25,000% within 24 hours. The increased usage reinforced the buyback story as the platform revenue continued supporting direct PUMP buys.
At press time, Pump.fun had spent $466.25 million on buybacks, removing 16.84% of the total token supply. The robust platform usage, therefore, introduced a direct connection between ecosystem activity and the contracting circulating supply.
PUMP’s trading activity expanded alongside the recovery, with 24-hour spot volume rising 66.59% to $353.8 million and price jumping 20% over 24 hours.
Even so, the stronger fundamentals, however, did not prevent short-term price volatility as investors increased exposure around the recovery.
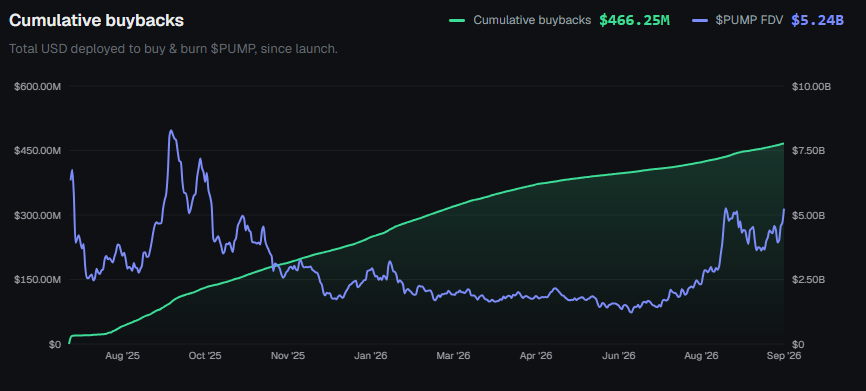
Leverage rushes back into Pump.fun
Market players on the derivatives increased their exposure considerably as PUMP recovered from its September lows. Derivatives volume notably surged 198.47% to $1.11 billion, reflecting a steep expansion in the speculative participation.
Additionally, the Open Interest (OI) followed the advance, jumping 17.26% to $429.46 million. The rising OI implied traders added leveraged positions rather than closing the existing ones.
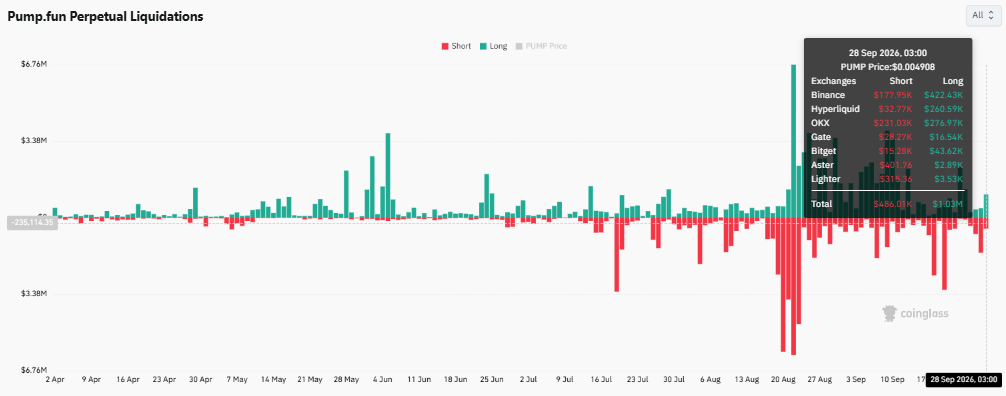
Additionally, liquidation data introduced another crucial element to the derivatives outlook. In particular, the long liquidations hit nearly $1.03 million, with the short liquidations totaling about $486,010 during the observed period.
The leveraged longs, therefore, absorbed substantially greater losses as PUMP faced renewed volatility.
Furthermore, the imbalance also highlighted how quickly bullish positioning faced pressure during the rally exhaustion.
The spot flow, however, offered a different perspective on the underlying supply around PUMP.
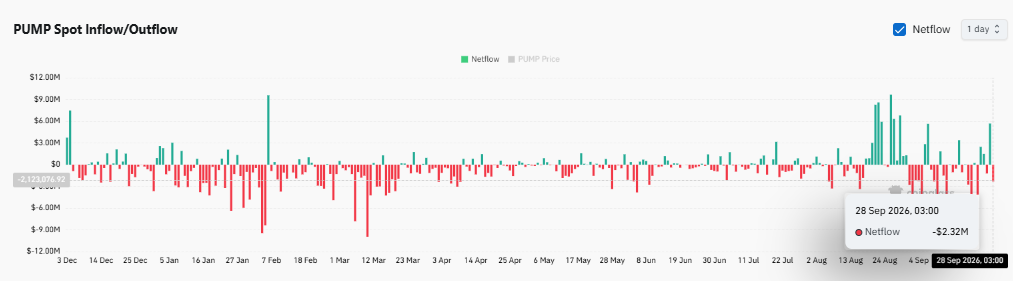
Spot outflows counter the leverage shakeout
At the time of writing, PUMP had recorded roughly $2.32 million in net spot outflows, implying that outflows exceeded inflows during the measured 24-hour period.
Notably, the withdrawals contrasted with the liquidation pressure affecting the leveraged traders. In fact, while the derivatives longs suffered heavier liquidations, spot participants, on the other hand, continued removing Pump.fun from exchanges.
This divergence, therefore, reinforced the broader supply story surrounding Pump.fun’s buyback activity. The buybacks had already reduced circulating supply, while spot outflows further limited immediately available tokens on exchanges.
Even so, these outflows alone, however, did not validate a continued upside after PUMP hit a key technical barrier. On the charts, the price action had already encountered selling pressure around the upper resistance area.
Correction tests PUMP’s recovery structure
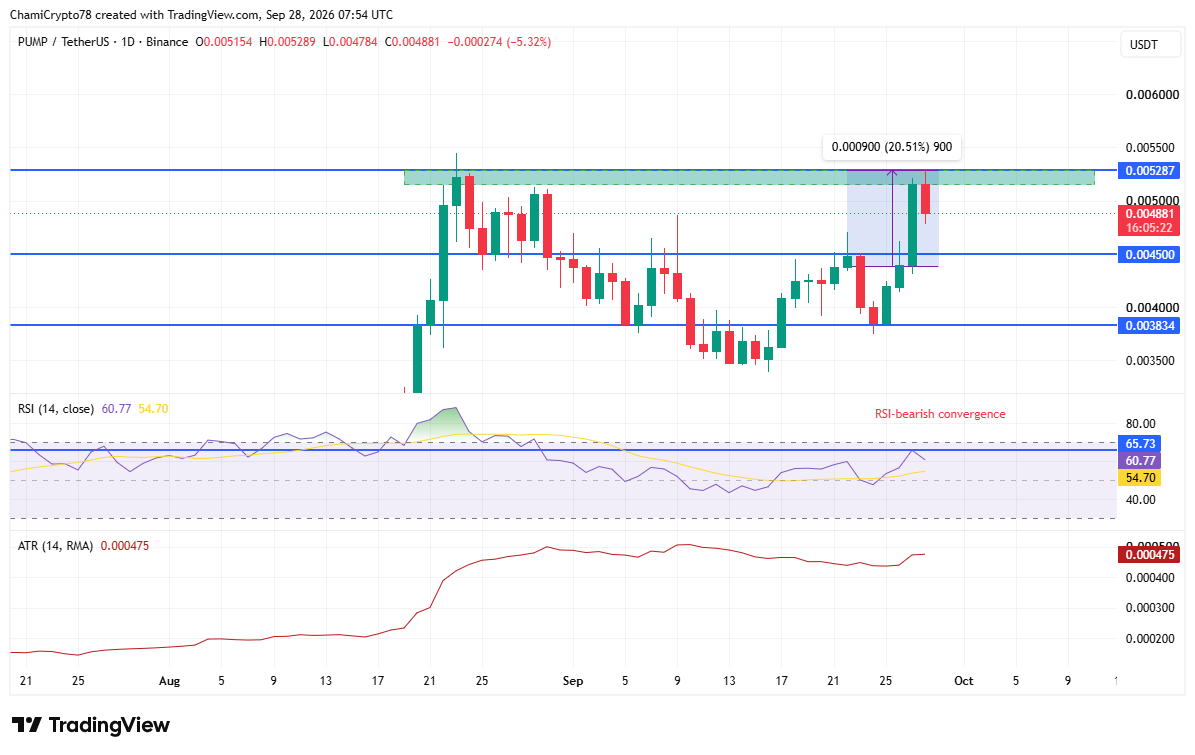
During the rapid price expansion, PUMP reached the $0.005287 price level before sellers forced a pullback, pushing the token back to $0.004881. Notably, the most recent daily candle had declined 5.32% as the correction emerged.
More importantly, the price retracement followed a roughly 20.51% daily advance from the $0.004500 region towards the resistance. That earlier price uptick left the $0.004500 level as the nearest key support beneath the prevailing market value.
Meanwhile, volatility also started rising again, with the 14-day ATR pushing towards 0.000475, suggesting wider price swings as PUMP retreated from resistance.
Additionally, the RSI indicator also cooled to 60.77 after touching the 65.73 area as of writing, confirming weaker buying pressure during the rejection. However, the technical indicator remained above its 54.70 moving average as the Pump.fun price retreated.
Ultimately, a successful defense of the $0.004500 region could protect the broader recovery and support another challenge of the $0.005287 supply zone.
Alternatively, losing that key level, however, could expose the deeper $0.003834 support zone.
Final Summary
- Pump.fun buybacks and spot outflows continued reducing available PUMP supply.
- PUMP’s correction puts $0.0045 support in focus before another potential recovery.