Wormhole [W] jumps 27% as spot buyers stay active – Yet THESE 2 signals warn…
Buyers are backing Wormhole’s rally. How much upside are late arrivals already paying for?



Wormhole [W] surged 27% over the past 24 hours as bulls maintained their strong hold on price.
While the rally showed strong momentum, there were risks ahead. Technical indicators pointed to stretched conditions, even as spot buying strengthened.
Is Wormhole’s rally getting too stretched?
Bollinger Bands track price movements around a moving average, with their upper and lower bands reflecting volatility.
W crypto token traded above the upper red band, showing that price had stretched beyond its recent trading range.
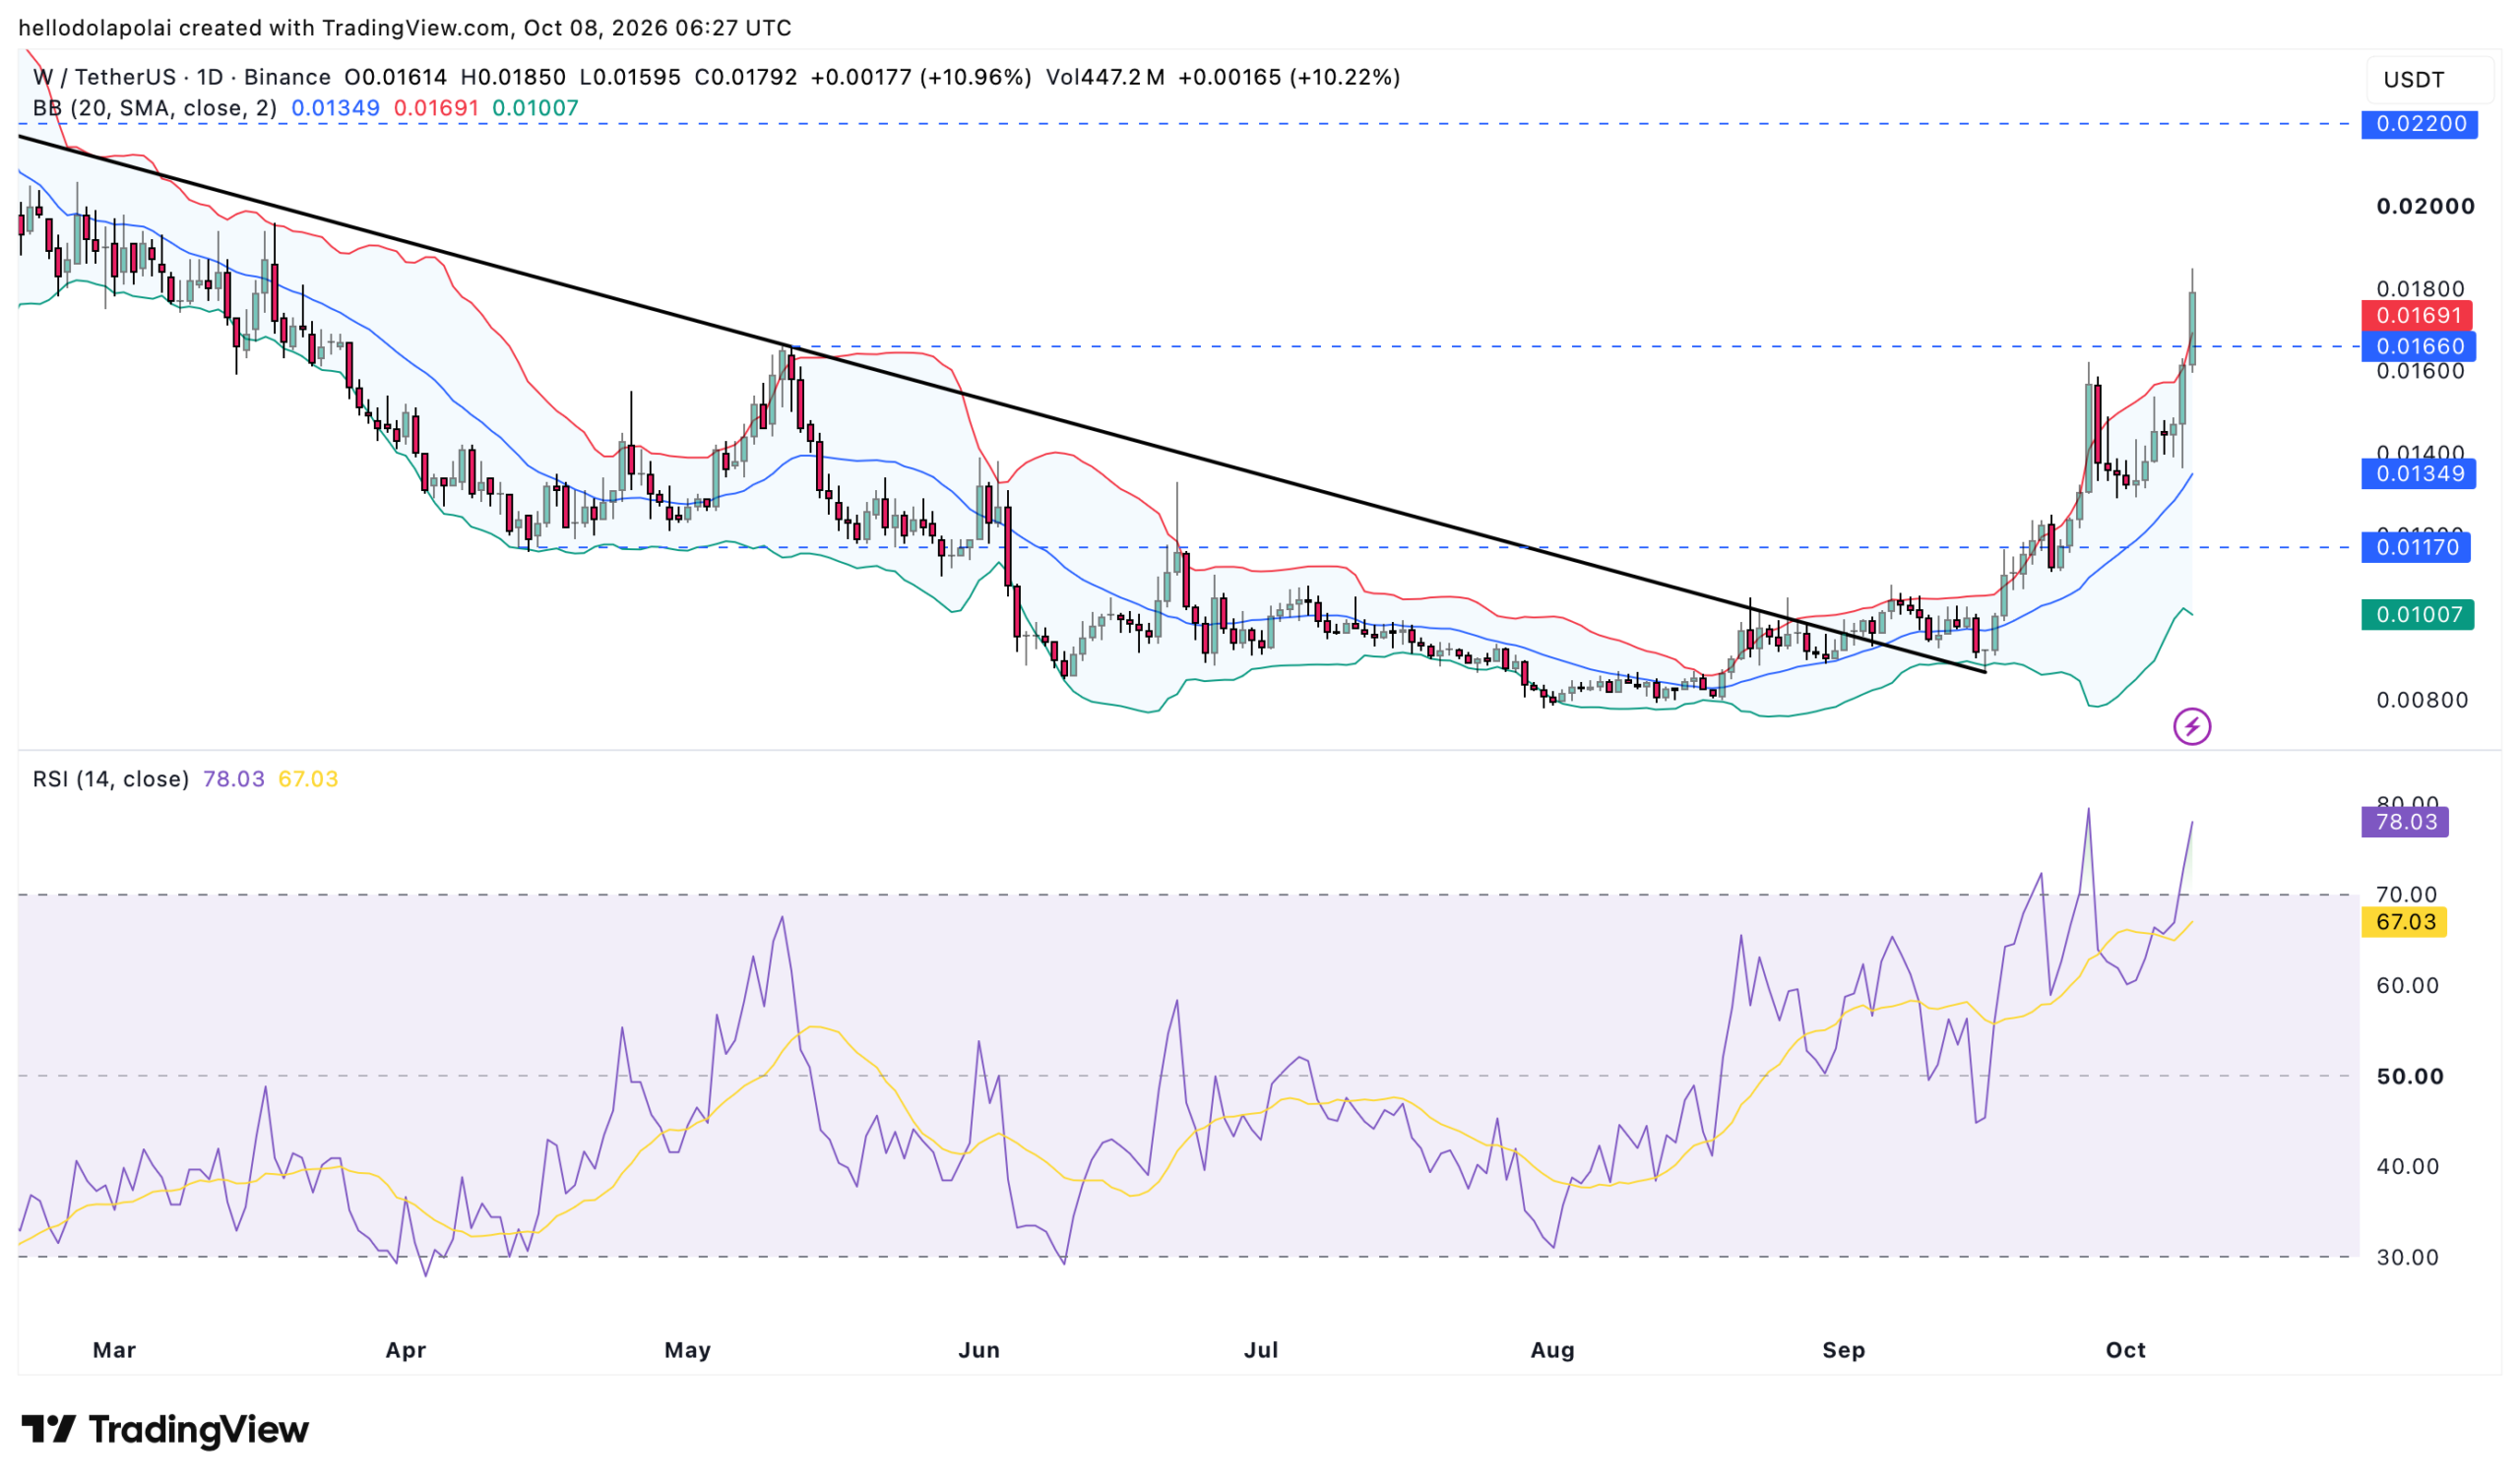
This could raise concerns about a pullback, although trading above the band can also accompany a strong trend.
The Relative Strength Index (RSI) carried a similar warning. It stood at roughly 78.03, above the 70 threshold associated with overbought conditions.
In other words, momentum remained strong, but buyers were entering after a sharp advance. Neither indicator establishes that a reversal will follow. They reflect recent price activity rather than determining the asset’s long-term outlook.
That left spot demand as another test of the rally’s staying power.
Are spot buyers still backing Wormhole?
The spot market offered a more supportive picture. On the 7th of October, Spot Netflow recorded a positive $226,620, according to CoinGlass.
This metric measures buy volume minus sell volume. A positive reading indicated that buying outweighed selling across the tracked markets.
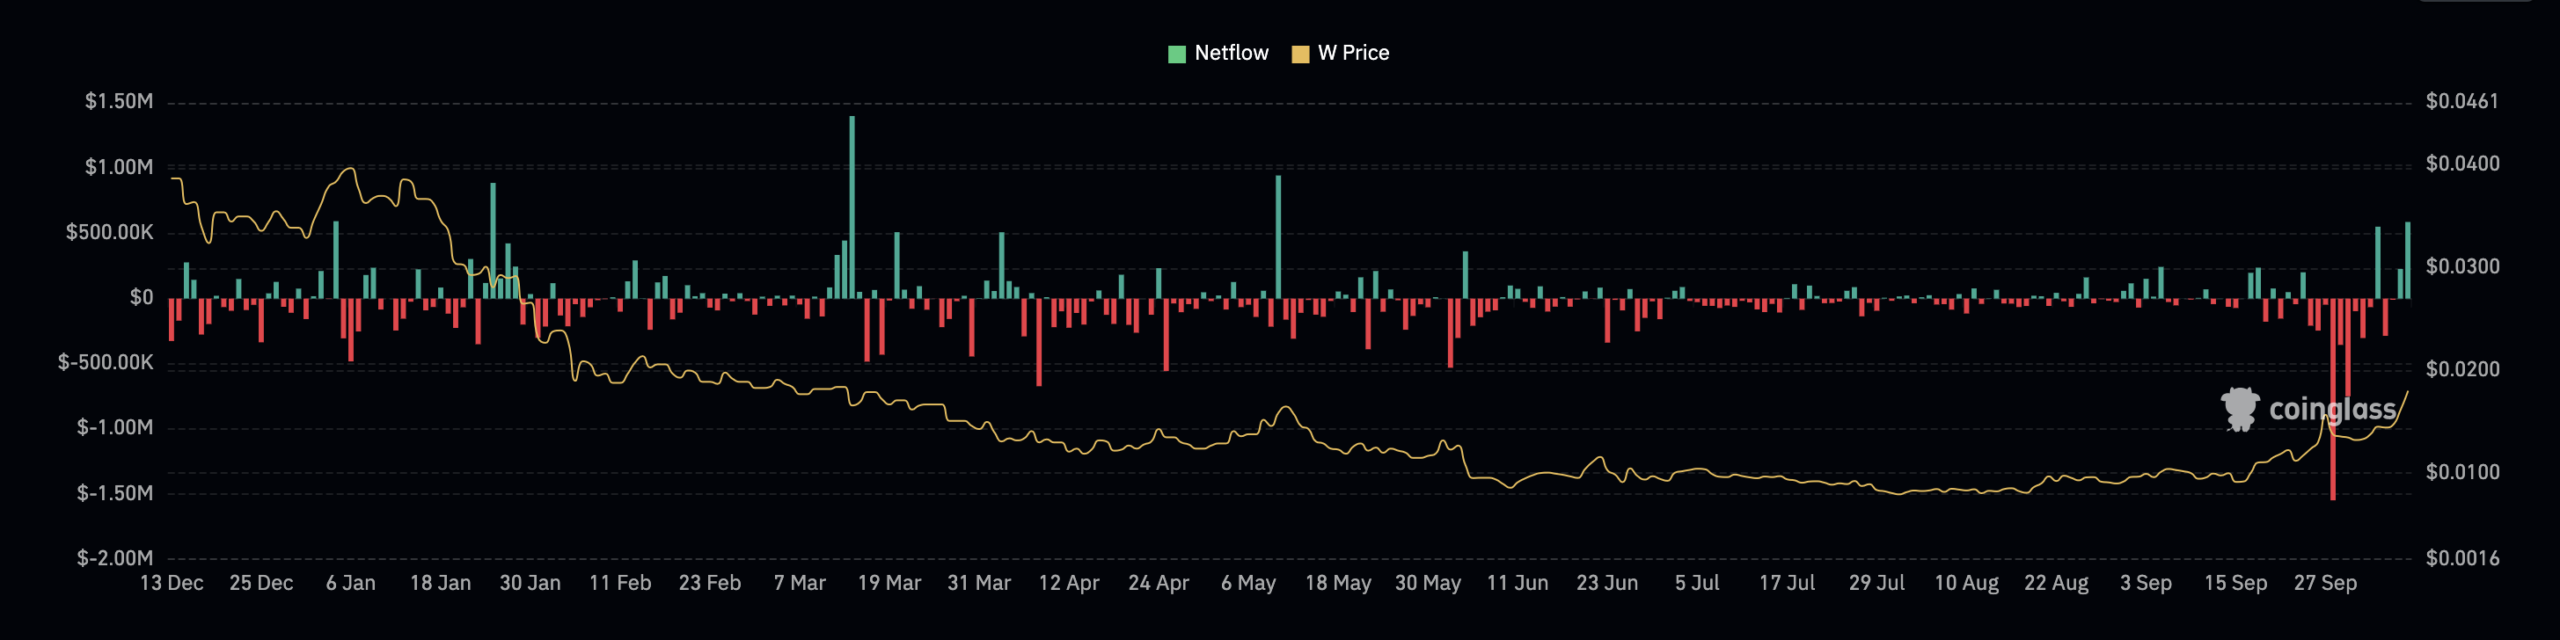
At the time of writing on the 8th of October, positive Spot Netflow reached roughly $567,000. These readings suggested that buyers continued supporting the price rally, even as the RSI flagged overbought conditions.
For now, bulls had demand behind them. A pullback could become more likely if that buying weakened and selling gained ground.
What could happen if Wormhole buying fades?
The Liquidation Heatmap showed scattered clusters, with several visible concentrations below the current price. These marked estimated levels where leveraged positions could face liquidation.
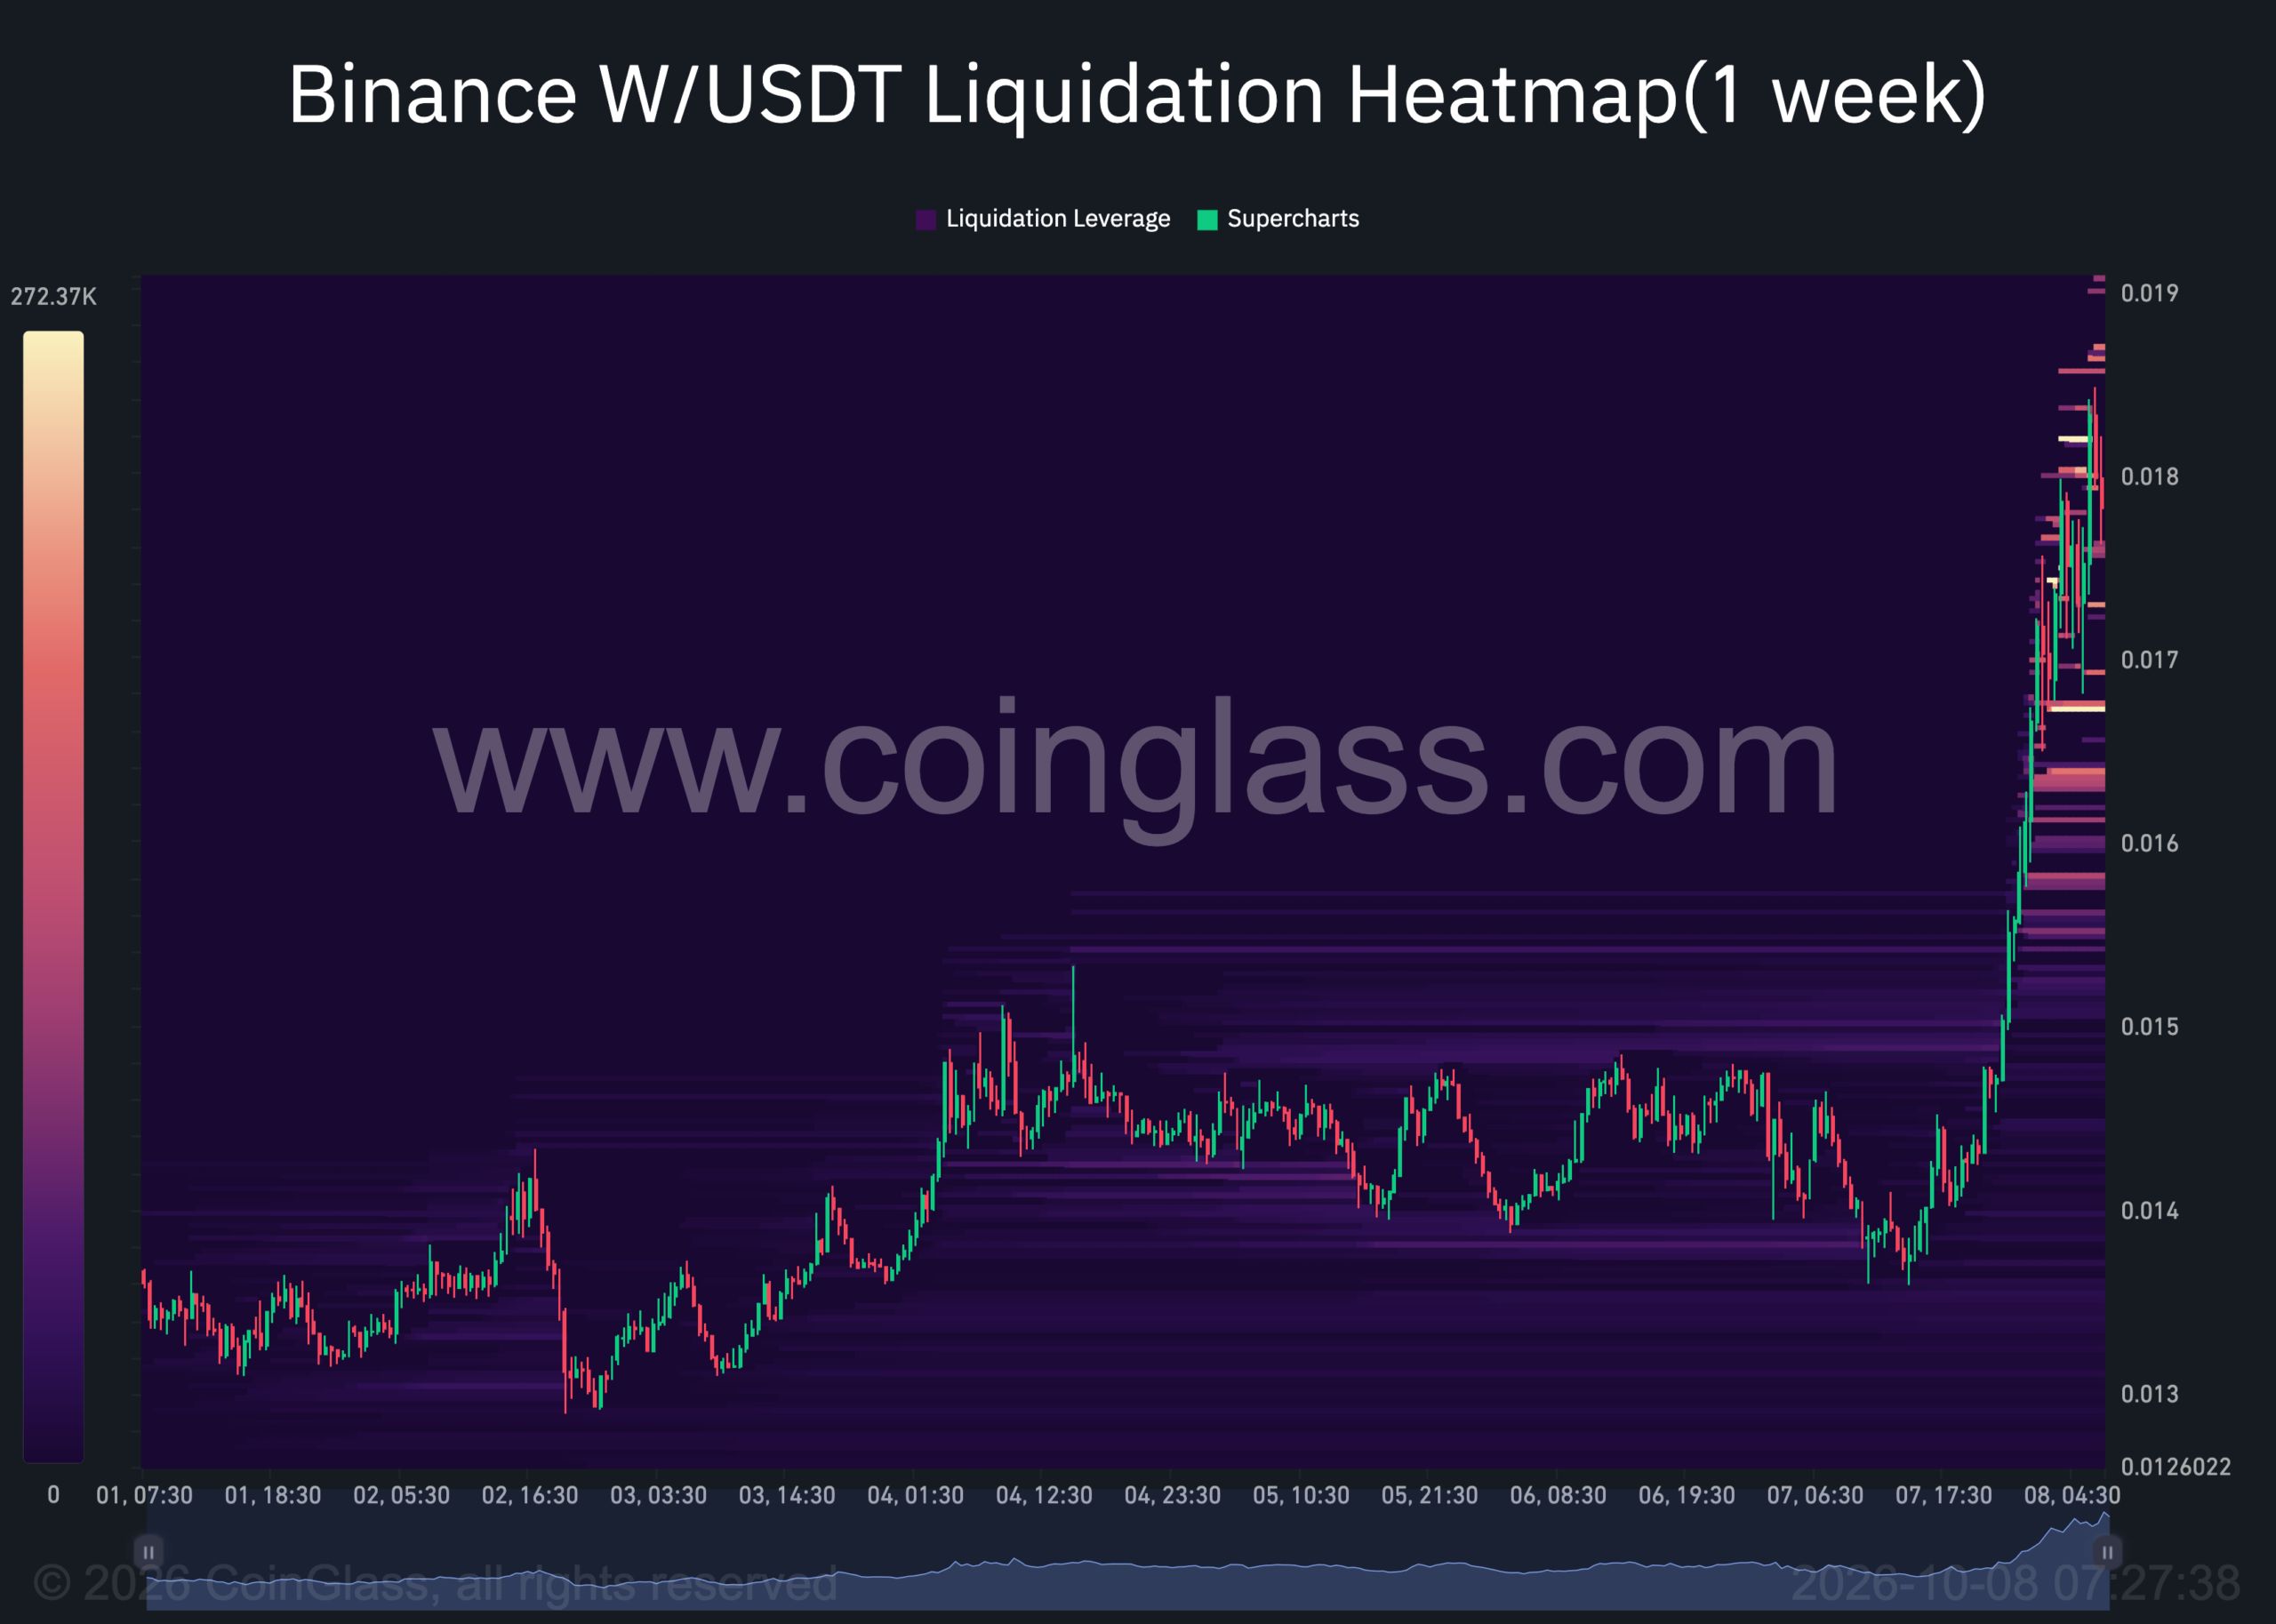
If W declined toward those levels, long liquidations could add forced selling and deepen the pullback. However, their presence alone does not establish that price will fall toward them.
For now, traders face a rally supported by spot buying, alongside stretched momentum and potential liquidation risk below price.
Final Summary
- Wormhole’s 27% rally pushed RSI into overbought territory, raising pullback risk without confirming a reversal.
- Positive Spot Netflow indicated net buying; liquidation clusters below price could amplify losses if W declines.