Why XLM’s bearish bias remains despite Stellar’s recent positive updates
The Stellar price action showed a bearish shift in character towards the end of October.



Stellar [XLM] token prices have slid another 3.11% in the past 24 hours, a continuation of the steady price decline since the end of September. Back then, XLM had reached $0.236, signaling a continuation of the uptrend at that time.
A lot has happened since then.
Assessing the XLM market sentiment
On the bright side, the post-quantum Stellar era of security takes its first step with the Bell upgrade, scheduled for November. Stellar also became a default network in MetaMask’s mobile app and browser extension.
The Mercado Bitcoin security incident, coming so soon after the Binance heist, once again upset market sentiment. It was reported that the attacker held 6.7 million XLM.
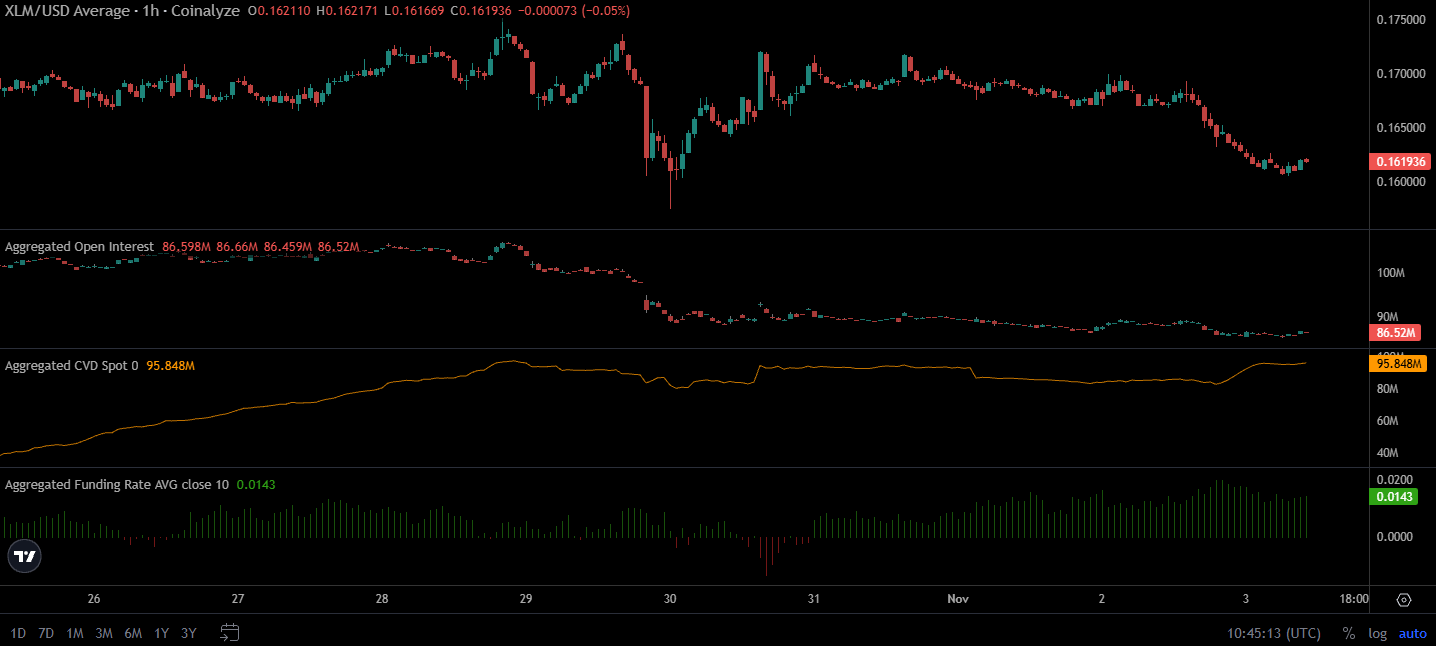
A healthy market correction has become the potential start of a bearish trend for Stellar. In the short term, the Open Interest’s lack of movement showed a lack of speculative capital flows.
The spot CVD saw a jump higher, and CoinMarketCap revealed a 39.5% daily trading volume uptick. Funding rates were also positive.
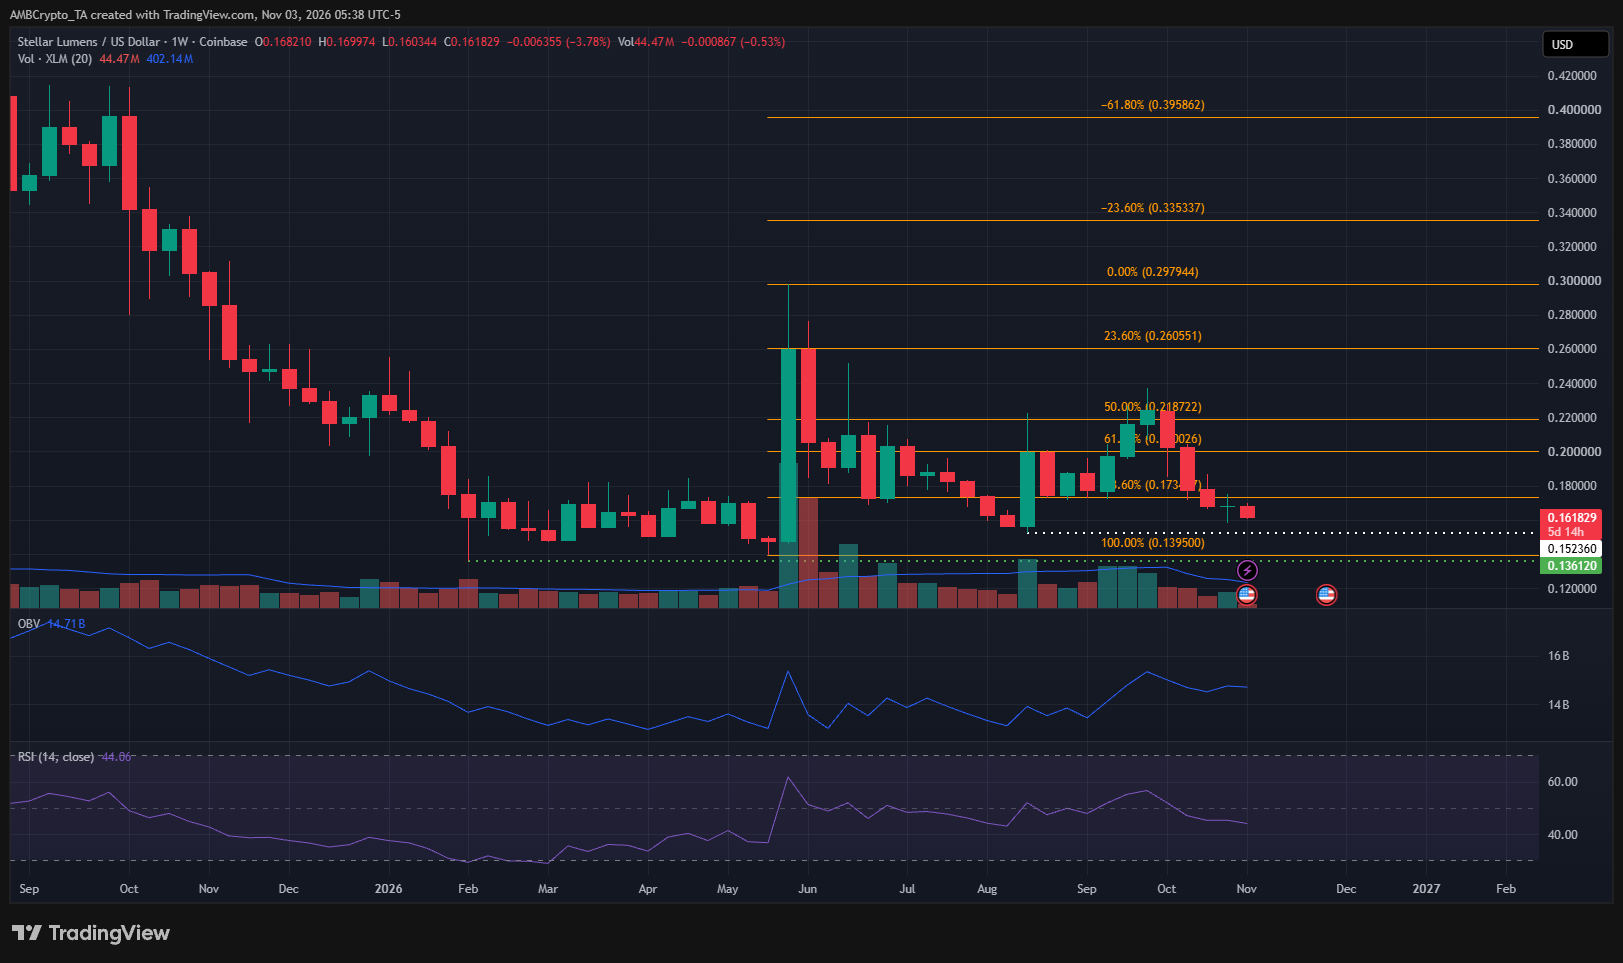
The weekly timeframe showed a bullish structure in place. The OBV has not sunk dramatically, showing the selling during the two corrections this year was not sizeable.
At the same time, the 78.6% Fibonacci retracement level at $0.173 has been ceded to the bears. The momentum was bearish, and positive funding rates and intraday spot CVD spikes won’t mask it.
Stellar swing traders brace for trend shift
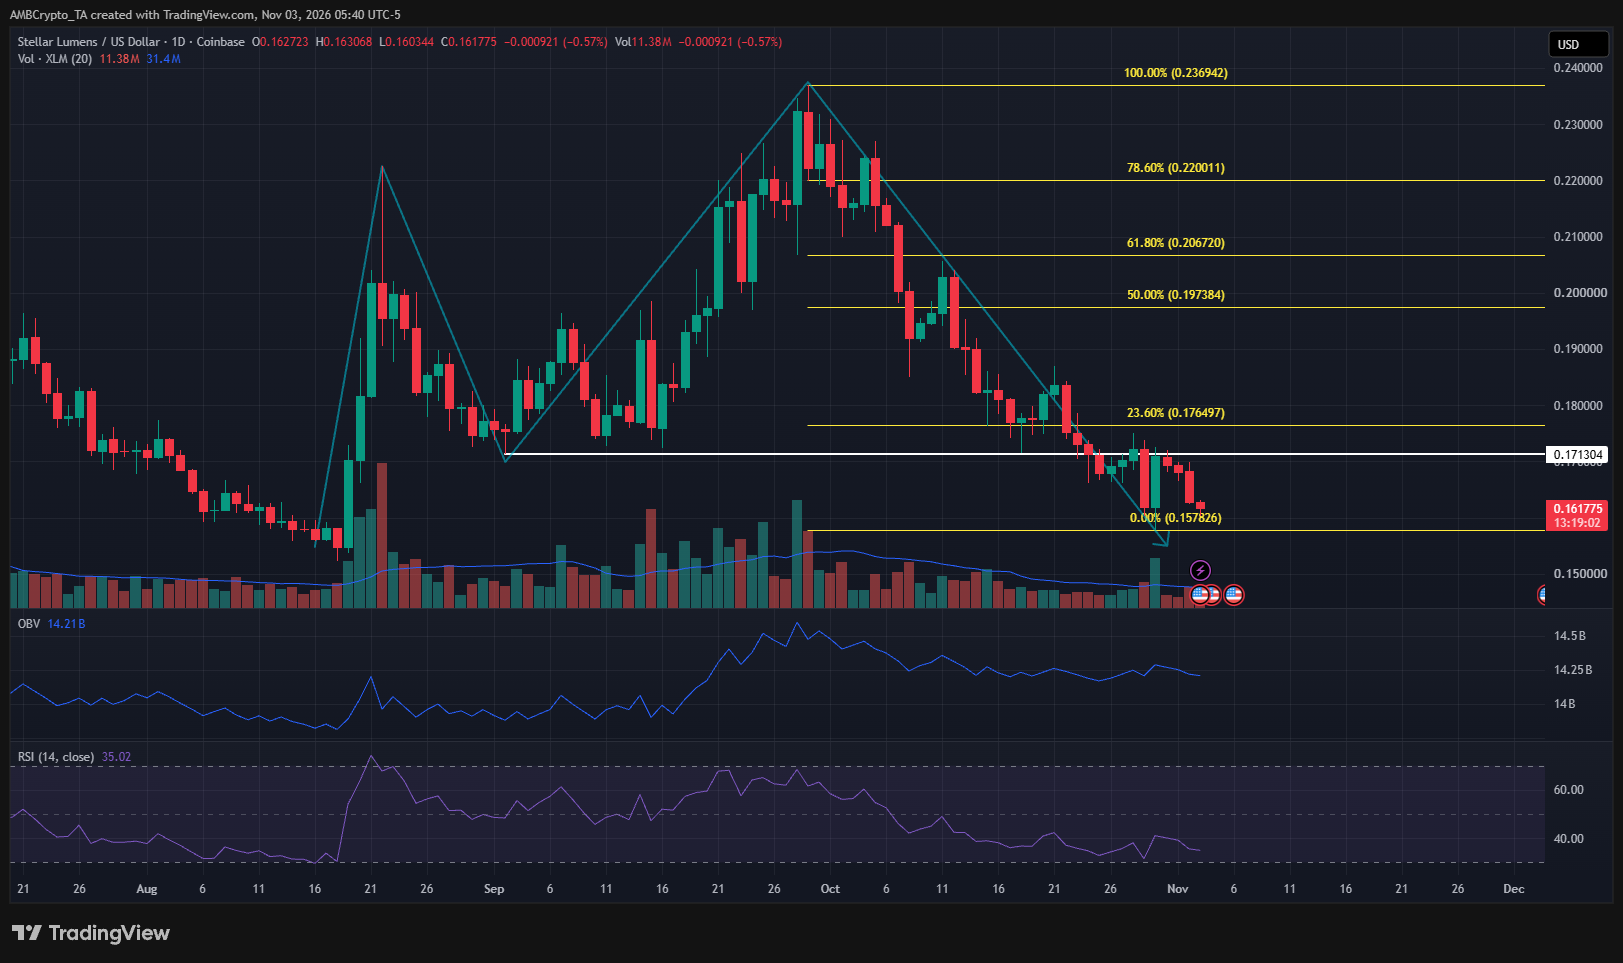
The mapped swing structure (cyan) showed a bearish change of character when $0.171 was lost in the second half of October. The feeble bounce from $0.157 to retest this resistance zone cemented the short-term seller dominance.
It is possible that XLM will bounce toward the $0.20 psychological round-number supply zone in the coming weeks.
Since the weekly timeframe was bullish, an internal structure shift on the daily chart – that is, a daily session close above $0.175 – can be taken as a sign that bulls were back in control.
However, even then, swing traders and long-term investors should keep an eye on capital inflows and market sentiment.
A Bitcoin [BTC] selloff and a market-wide liquidation cascade during fearful times like the past few weeks could trigger an XLM downtrend continuation.
Final Summary
- The Stellar price action showed a bearish shift in character towards the end of October.
- Despite the positive updates the network has seen recently, the wider market sentiment has helped give sellers the advantage.