
- Chainlink’s symmetrical triangle pattern suggested a potential bullish breakout.
- Breaking the $16 resistance could lead to a significant price surge, with a target price of $37.278.
Chainlink [LINK] traded at $13.42 at press time, marking a 3.07% increase in the last 24 hours, according to Coingecko.
A clear symmetrical triangle pattern has emerged on the weekly timeframe, drawn from the $22.87 highs on the 11th of March to the $11.01 low on the 1st of July.
This pattern suggested a high probability of a bullish breakout.
Meanwhile, Crypto analyst Ali on X (formerly Twitter) highlighted that the TD Sequential presented a buy signal on the 4-hour chart, adding to the bullish sentiment.
If LINK manages to break through the $16.0 resistance level, a surge of up to 143% is anticipated, projecting the price to approximately $37.278.
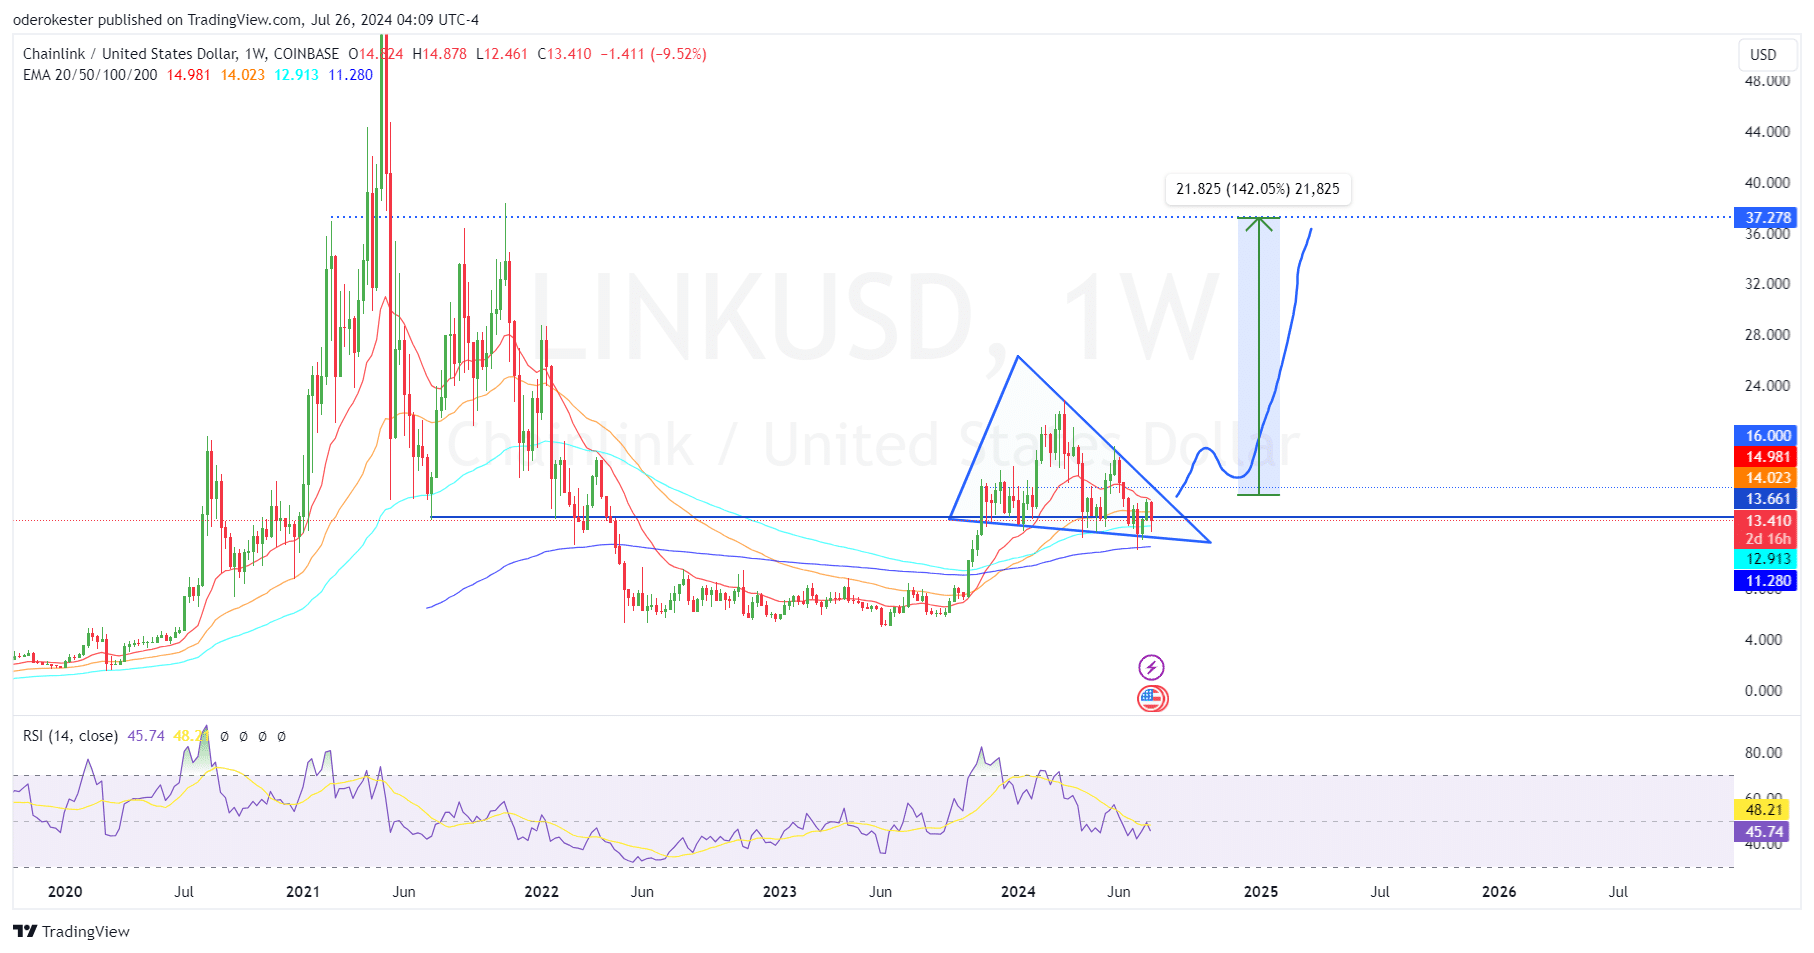
Source: TradingView
This potential breakout could mark a significant upward movement for the coin, reflecting a strong market interest and confidence in Chainlink.
Technical analysis and resistance levels
LINK has faced resistance at the $13.66 level throughout Q1 and Q2, extending the correction move to the trendline support of $12.08.
Recently, LINK bounced off this support and traded higher at $13.42, aligning with key moving averages (EMA 20/50/100/200). If these levels hold, LINK could rally by 27.6% to retest the weekly resistance at $16.22.
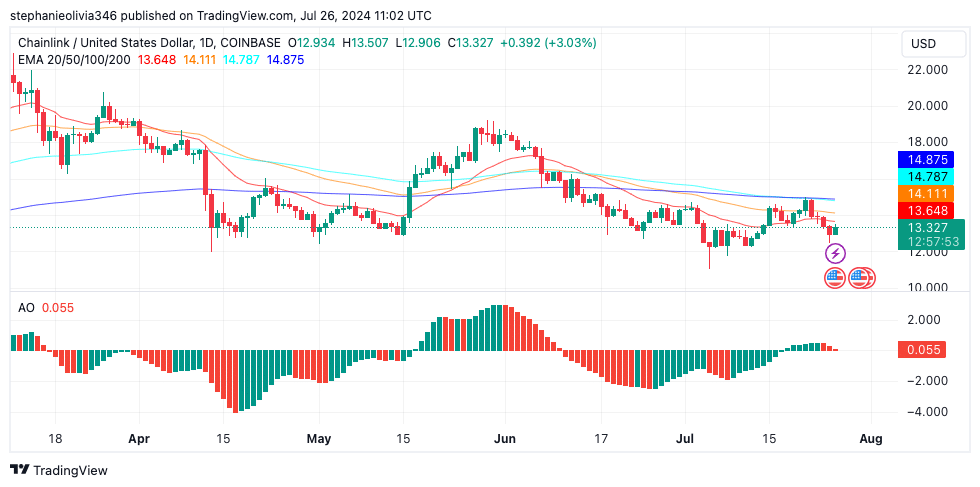
Source: TradingView
At the time of writing, the Relative Strength Index (RSI) on the daily chart has dipped just below the 50 mid-line, while the Awesome Oscillator (AO) is following suit.
For a bullish comeback, both indicators must stay above their mean levels.
A sustained rise in these indicators would provide a strong boost to the recovery rally, potentially leading LINK towards the $16.22 resistance level.
Potential downside and key price levels
Despite the bullish outlook, if LINK’s price closes below $11.04 on the weekly chart, it could invalidate the bullish theme.
This scenario would create a lower low, potentially causing LINK’s price to decline by 60.9% to retest its weekly lows of $4.996 from the19th of June 2023.
The activity on the Chainlink network, indicated by active addresses and transaction volume, showed a stable trend with occasional spikes.
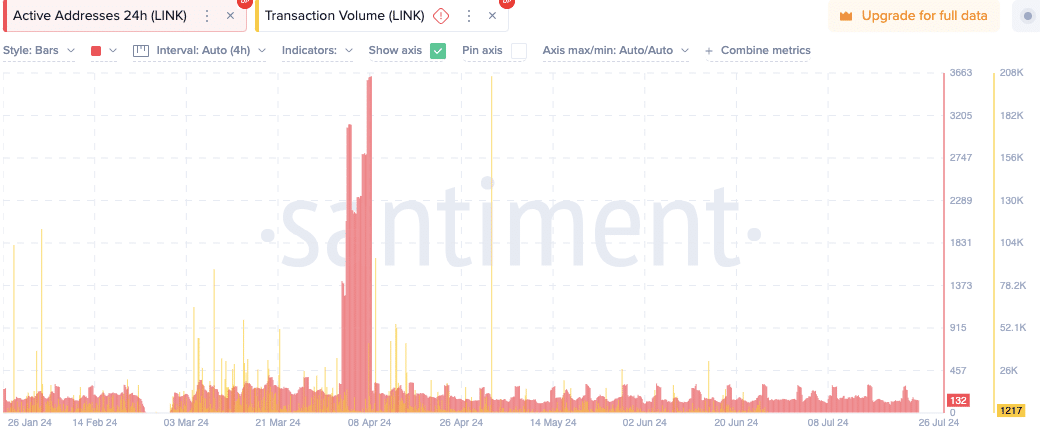
Source: Santiment
Realistic or not, here’s LINK’s market cap in BTC’s terms
A significant surge in both metrics was observed around the 8th of April 2024, suggesting a temporary increase in activity.
Following this peak, the metrics returned to consistent levels, pointing to a stable period before and after the April surge.


