Solana – Tracing SOL’s price action after it re-tests THIS key level
SOL's price charts have been accumulating a lot of positive momentum lately. Does that mean much?
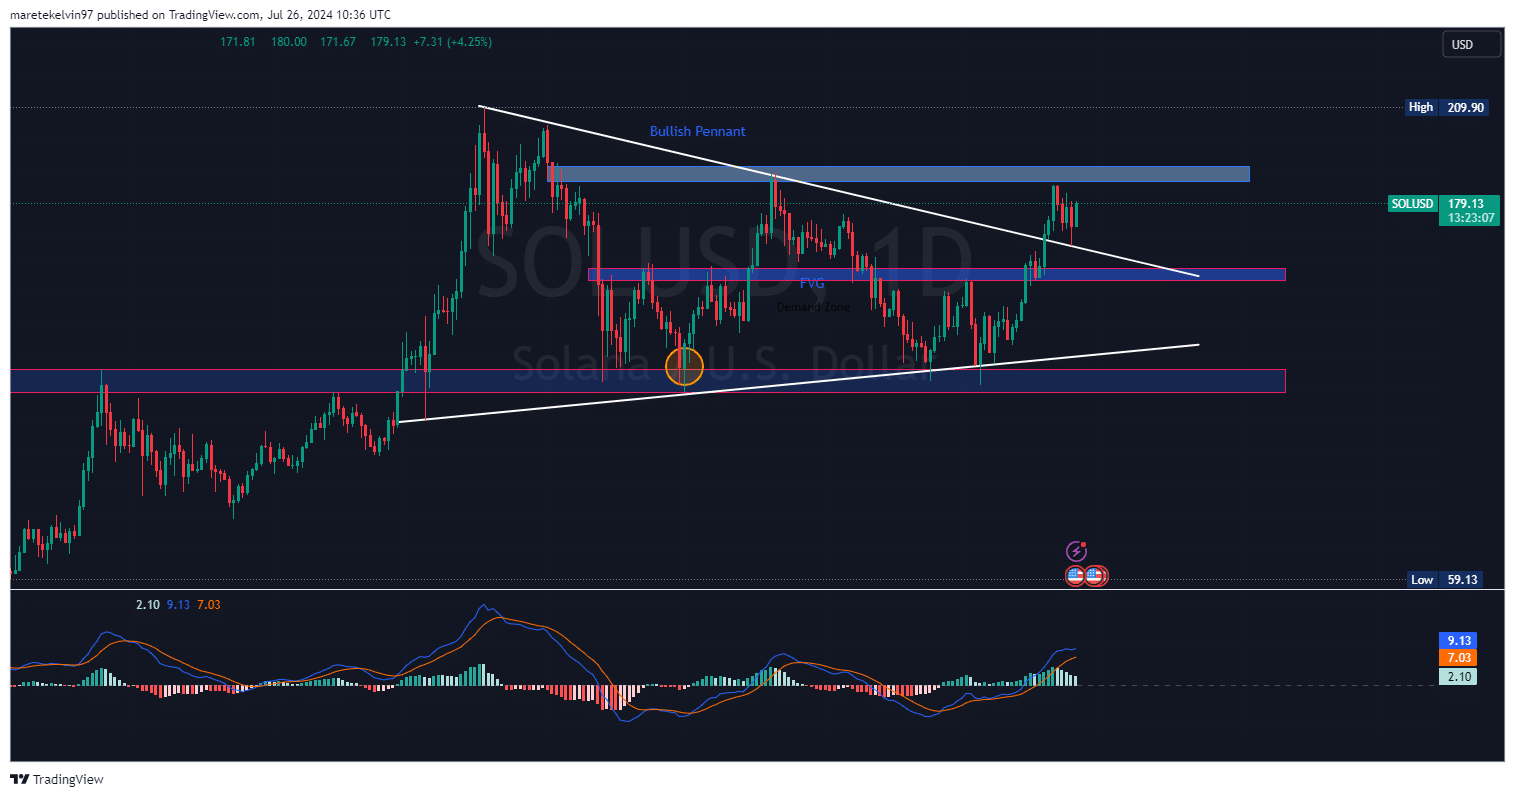
- Solana’s price has bounced by 8% after retesting its bullish pennant support
- Positive funding rates and greater volumes might support a potential upward move
Solana has surged by 8% since re-testing the key support level at $166. The coin was consolidating within a bullish pennant pattern before it managed to break free past the pattern resistance level back on 19 July. SOL then pulled back to its key level just after breaking out of the bullish pennant resistance zone.
At the time of writing, Solana seemed to be building bullish momentum as it prepared to rally to the next resistance level at $190. If the bullish pressure is enough, then SOL may rally further past these key levels.
What do the metrics say?
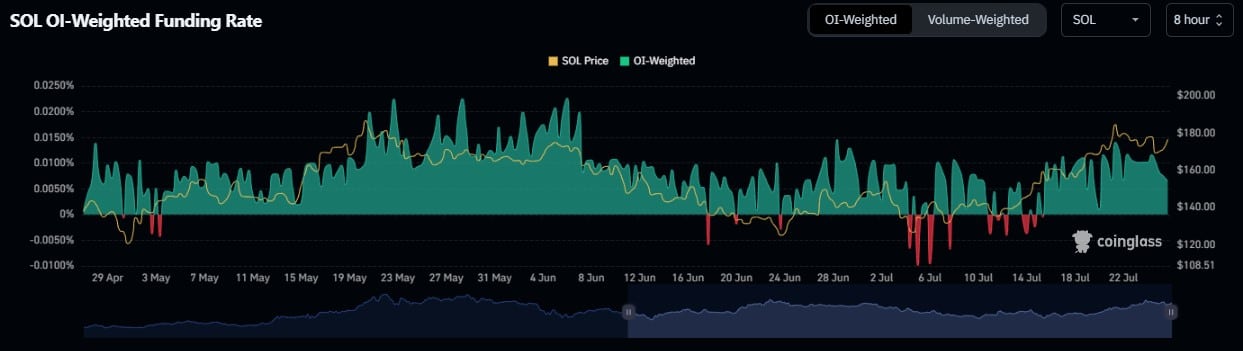
According to OI-weighted funding rate data from Coinglass, significant volatility has been seen across Solana’s funding rate over the past few weeks.
In fact, recent data suggested a slight positive bias in the funding. This can be interpreted as growing bullish sentiment among investors in the market.
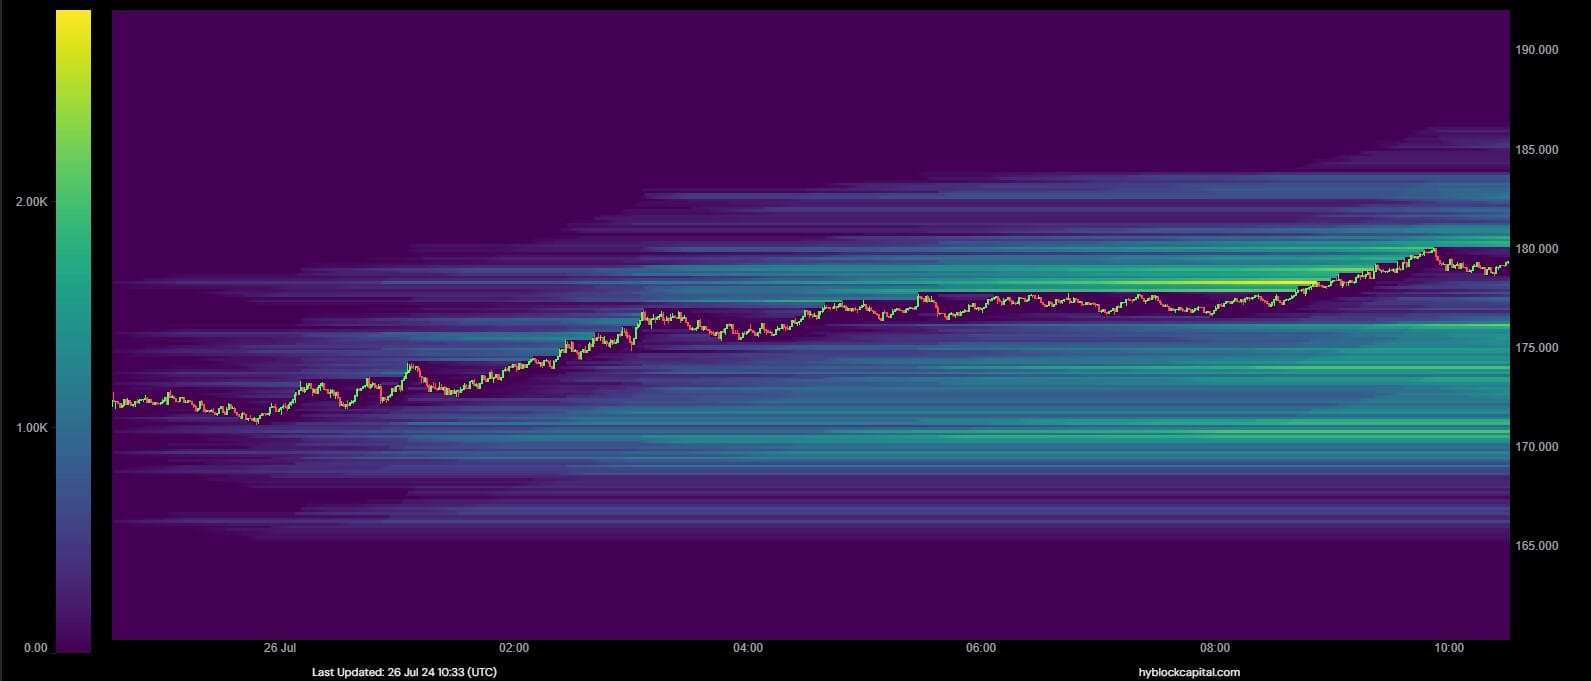
On the back of the aforementioned Open Interest, AMBCrypto further analysed the liquidity data to assess the market direction.
The data revealed an accumulated liquidity pool just above its press time trading price – A sign that the market had a bullish bias, one that can act as a price magnet for further price surges.
Now, Solana has also been the talk of the town over the past week. Currently, it is third in line as far as a prospective spot ETF approval is concerned. It has enjoyed increased social mentions across various social media platforms too. These mentions may precede a potential bull run that may be on the horizon.
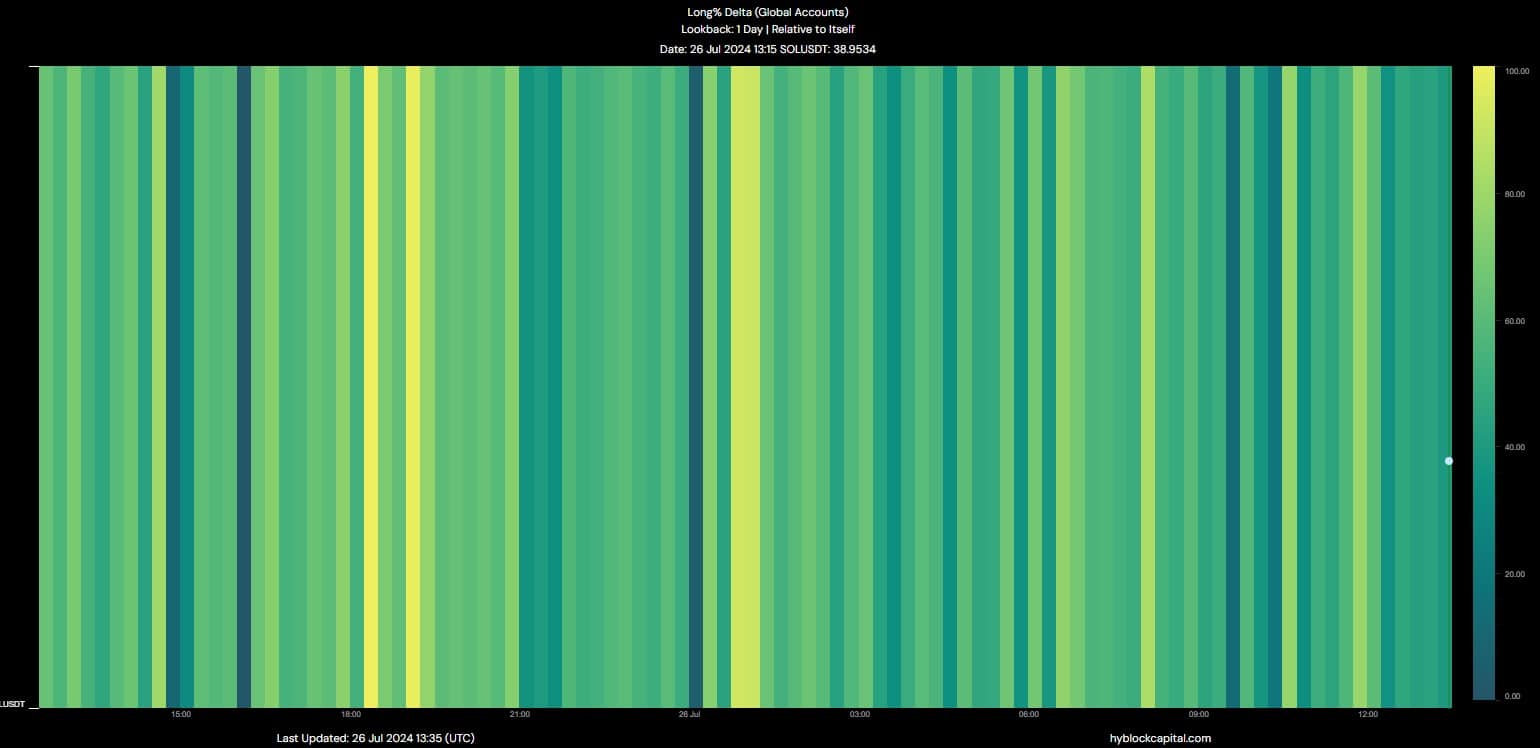
Additionally, delta data for global accounts provided us more information on Solana’s market dynamics.
AMBCrypto’s analysis of the long delta data from Hyblock indicated spiked longs. At the time of writing, the delta stood at 38.95. This accumulation of long positions may consequently lead to a potential price rally on the charts.
What next for Solana?
The altcoin’s price action affirmed its market trajectory, as a breakout from a bullish pattern often presides over a potential bullish continuation.
However, with increased volatility, any price corrections that break below it could signal bearish pressure.


