A full picture of Tron’s [TRX] price trajectory after this breakdown

Disclaimer: The findings of the following analysis are the sole opinions of the writer and should not be considered investment advice
After relishing a position above the EMA ribbons for a few weeks, the 61.8% Fibonacci resistance put Tron [TRX] back on its bearish track. The decline from the $0.08-level reignited the bearish efforts in pulling TRX below the 23.6%-level.
The alt would likely see a sustained breakdown from its bearish pennant-like structure in the coming sessions.
Any rebounding signals could hint at a near-term recovery before a reversal from the 20 EMA. At press time, TRX was trading at $0.06286, down by 3.28% in the last 24 hours.
TRX Daily Chart

TRX saw gradual improvements after dropping towards its yearly low on 15 June. The recovery from its long-term support entailed a bearish pennant-like setup on the daily chart.
With EMA ribbons looking south, the sellers assumed stronger control in the current market structure. As a result, the pennant noted an expected breakdown from the 20 EMA while falling below the 23.6%-level.
Continuous bearish momentum can pull TRX towards the $0.0601-$0.057 range. Investors should look for rebounding signals from this region. In case of a bounce-back, the alt could see a revival until the south-looking 20 EMA near the $0.065-zone.
Investors/traders must carefully assess the broader macro-economic sentiments affecting placing long bets. As the 20/50 EMA fell below the 200 EMA (green), the bears have only reaffirmed their vigor.
Rationale
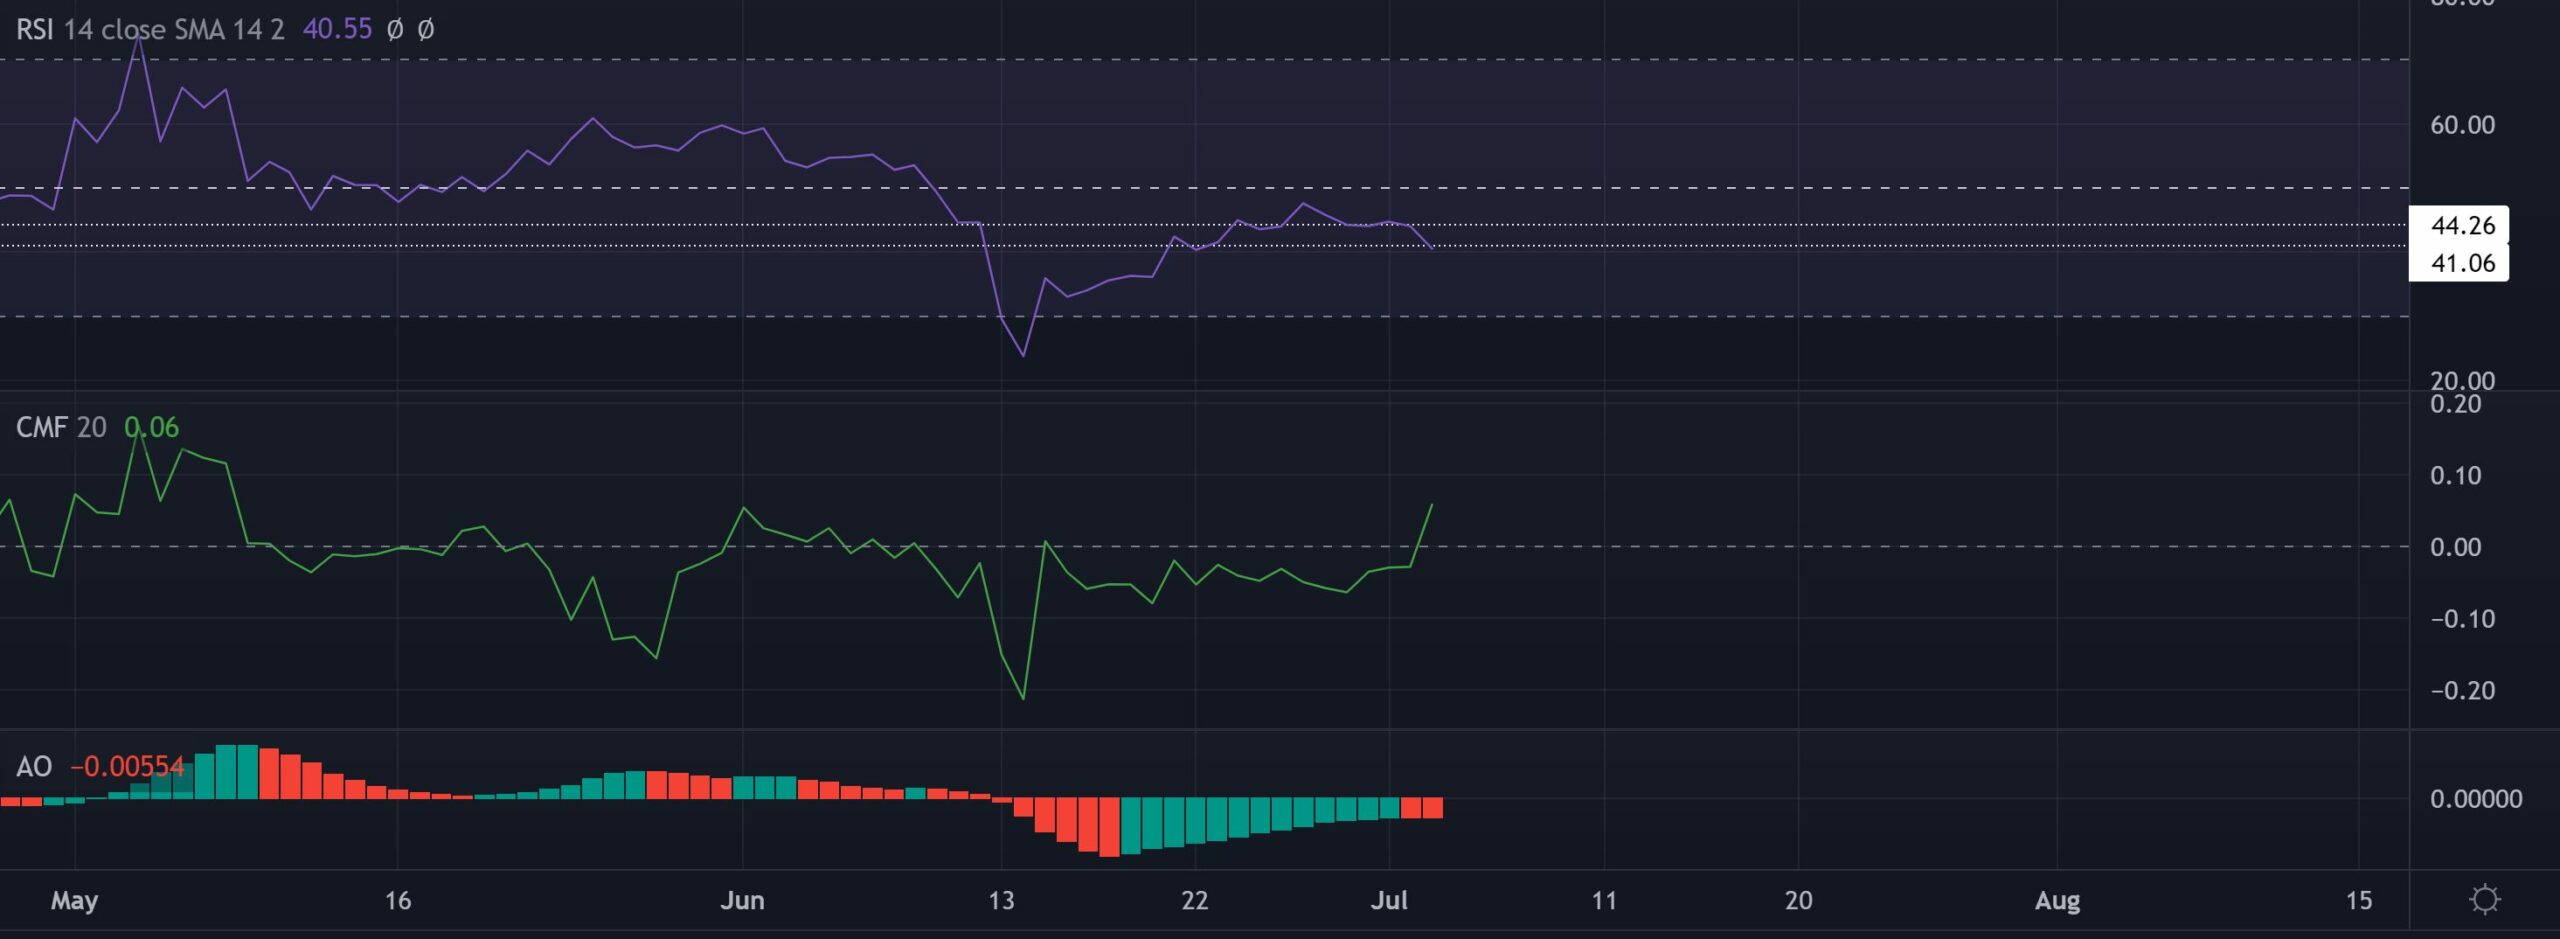
The Relative Strength Index (RSI) saw a stiff reversal from the midline. A sustained close below the 41-level would reaffirm the near-term decline tendencies.
As the CMF glides above the zero-mark, the buyers displayed a slight edge by ramping the money volumes. However, any reversals would affirm a bearish divergence with the price. Also, the AO resonated with the bearish narrative by refusing to close above the zero-mark for nearly three weeks.
Conclusion
Given the bearish pennant breakdown from the EMA ribbons, TRX could see a sustained decline before picking itself up. The targets would remain the same as above.
Nonetheless, investors/traders should consider Bitcoin’s movement and its impact on broader market perception to make a profitable move. An analysis of this would aid traders in anticipating the possibility of any bearish invalidations.


