- Aave has a bullish weekly structure, but more losses are expected in the coming days.
- A drop below the psychological $200 level could take prices to $141.
Aave [AAVE] had outperformed popular DeFi tokens, gaining 465% from July to December before beginning to retrace. This retracement phase has pulled prices lower as the market-wide sentiment worsened.
Bulls looking to accumulate more AAVE can keep an eye on the $141 and $177 levels and wait for a range formation.
In the near term, increased volatility is expected. A price move to $216 as a liquidity hunt could materialize in the coming hours.
Is Aave on the verge of losing the $200 support level
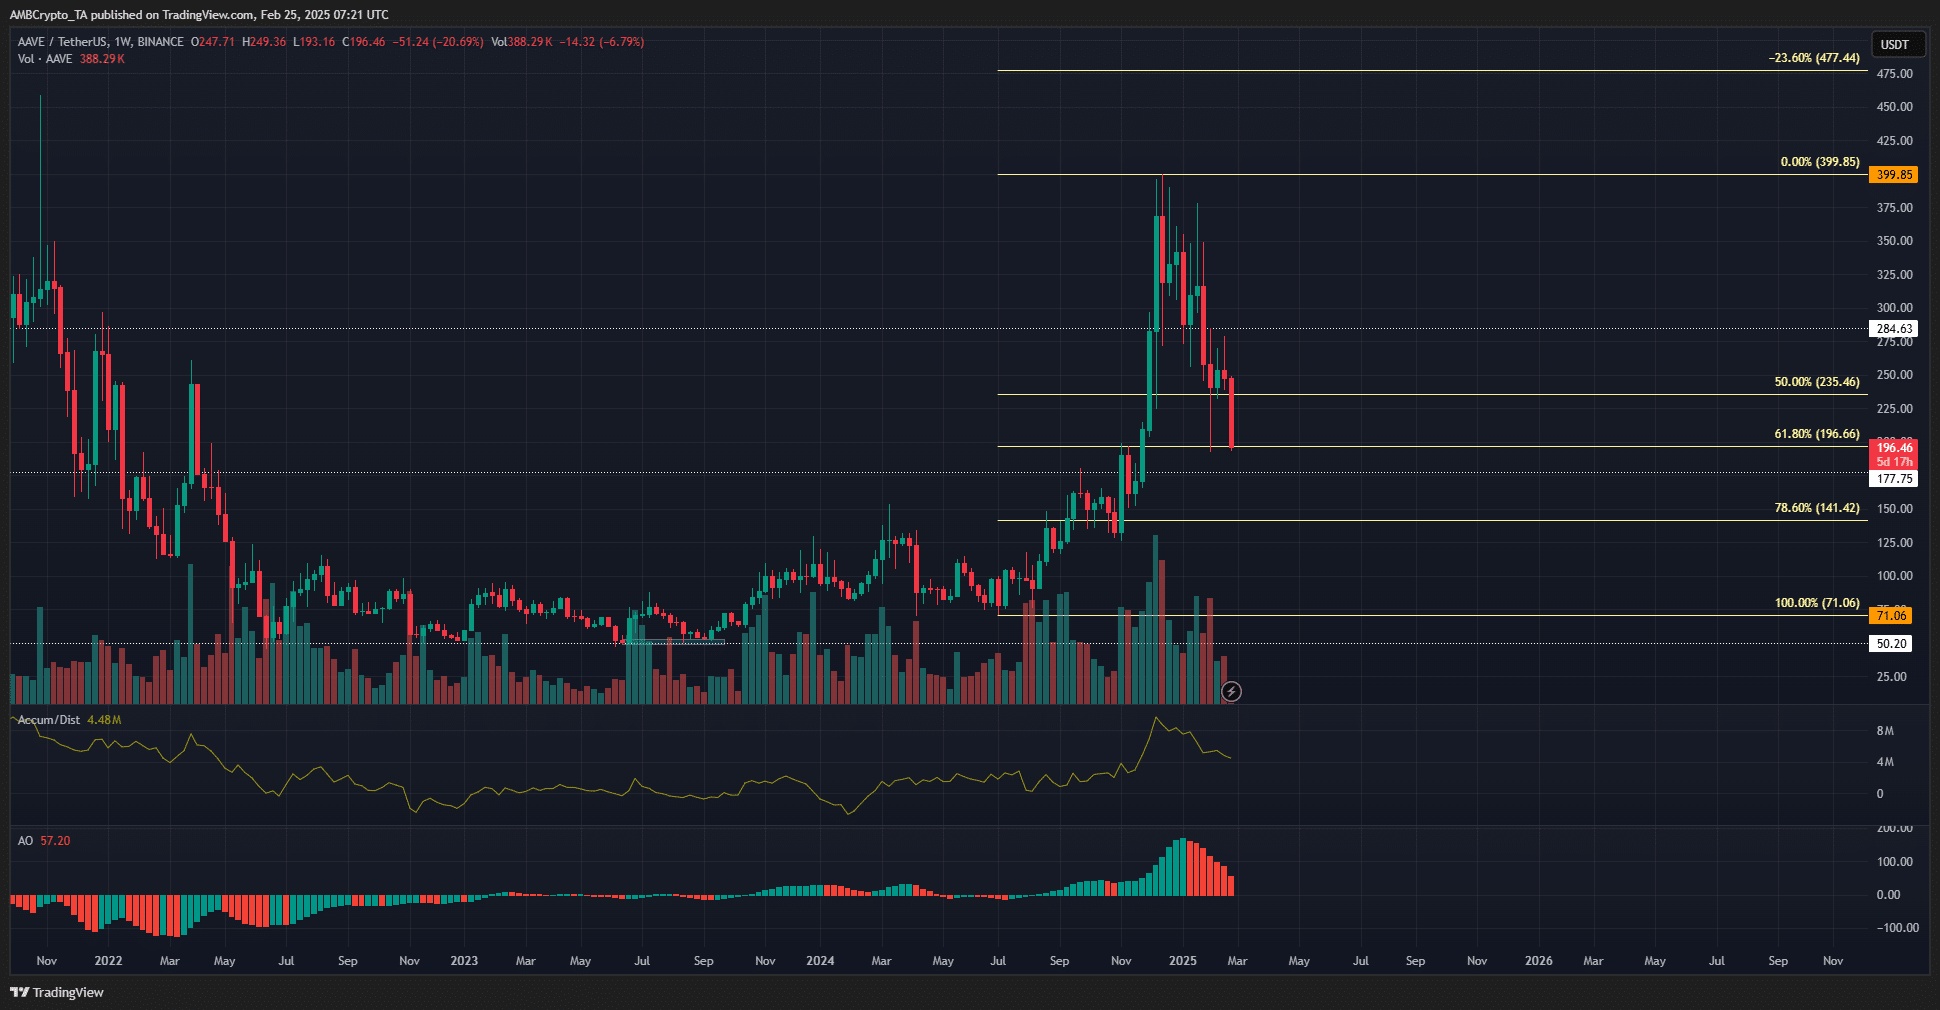
Source: AAVE/USDT on TradingView
Over the past two months, Aave has aggressively retraced the gains it made in Q4 2024. It has ceded the $284 and $235 support levels and is on the verge of falling below the $196 level as well.
To the south, the $177 and $141 levels are the next significant support levels where the bulls might make a stand. The swing structure on the weekly chart is bullish, but the current retracement could fall as deep as $125-$141.
The A/D indicator shows that the selling pressure has not undone the buying volume in recent months. The Awesome Oscillator noted the change in momentum around mid-January.
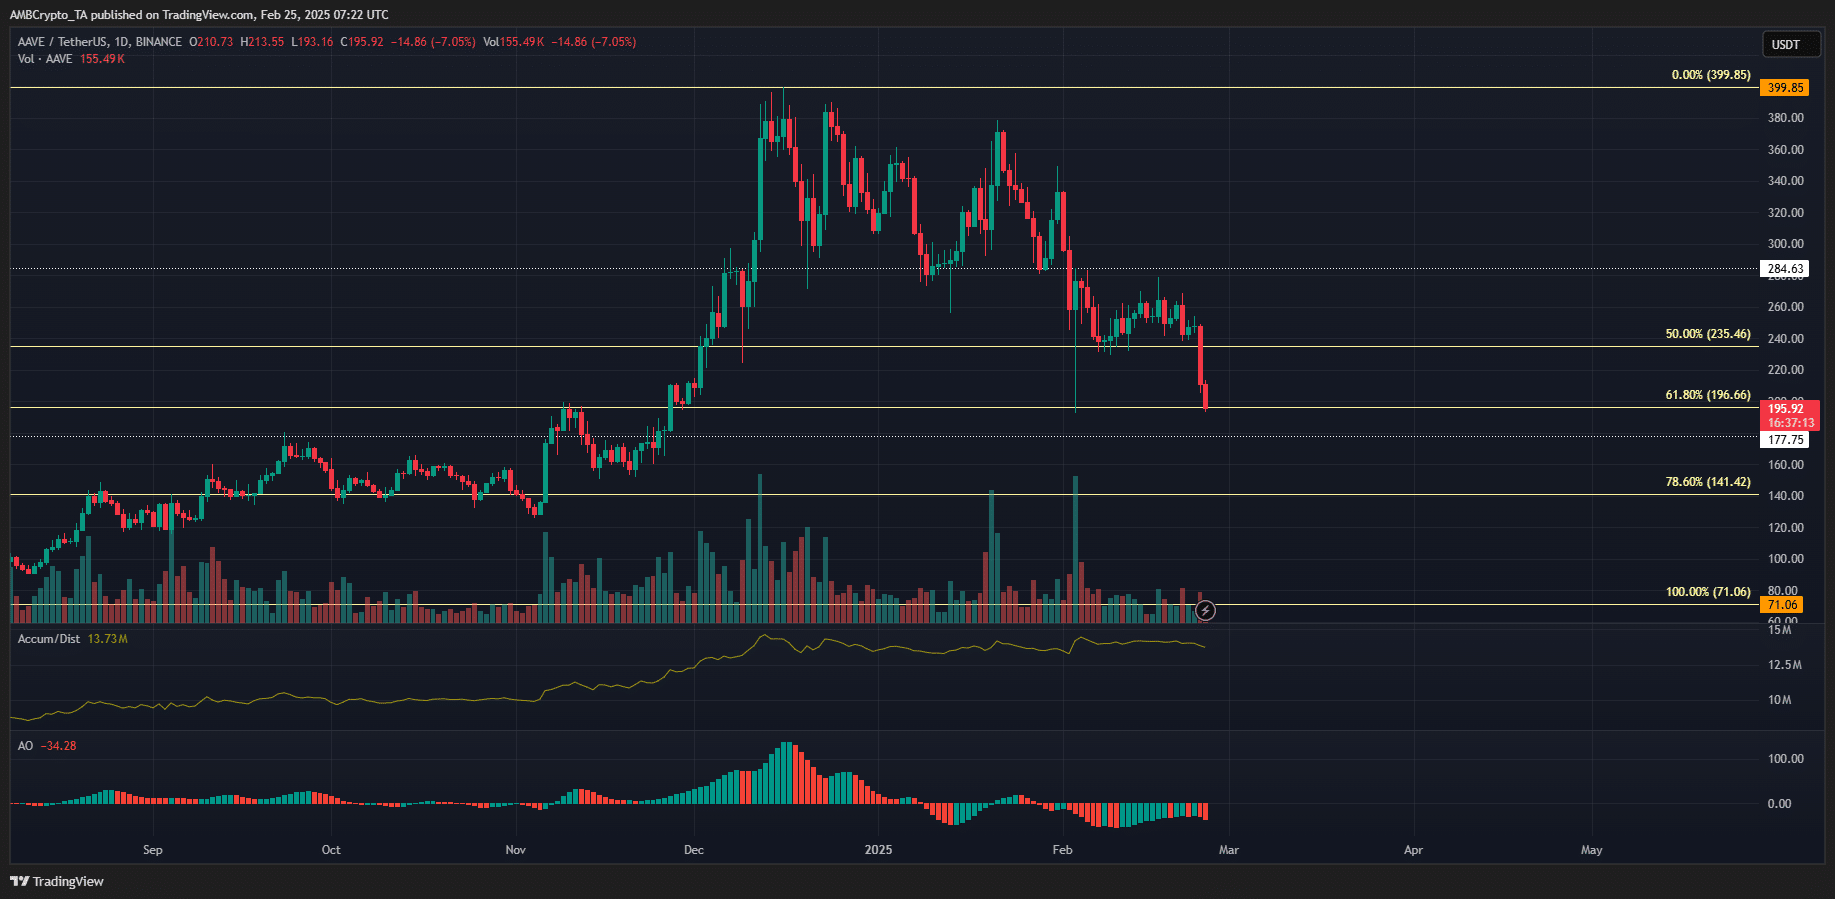
Source: AAVE/USDT on TradingView
The daily chart gave more actionable information for traders. The structure was firmly bearish, but the trading volume in recent days has been muted.
As a result, the A/D indicator continued to float near the high from January.
On the other hand, the Awesome Oscillator reflected clear bearish momentum. The $196, $171, and $155 levels were the support levels that a reversal might occur.
Aave buyers can wait for a range formation before looking to bid, as it would be a sign of consolidation after the pullback.
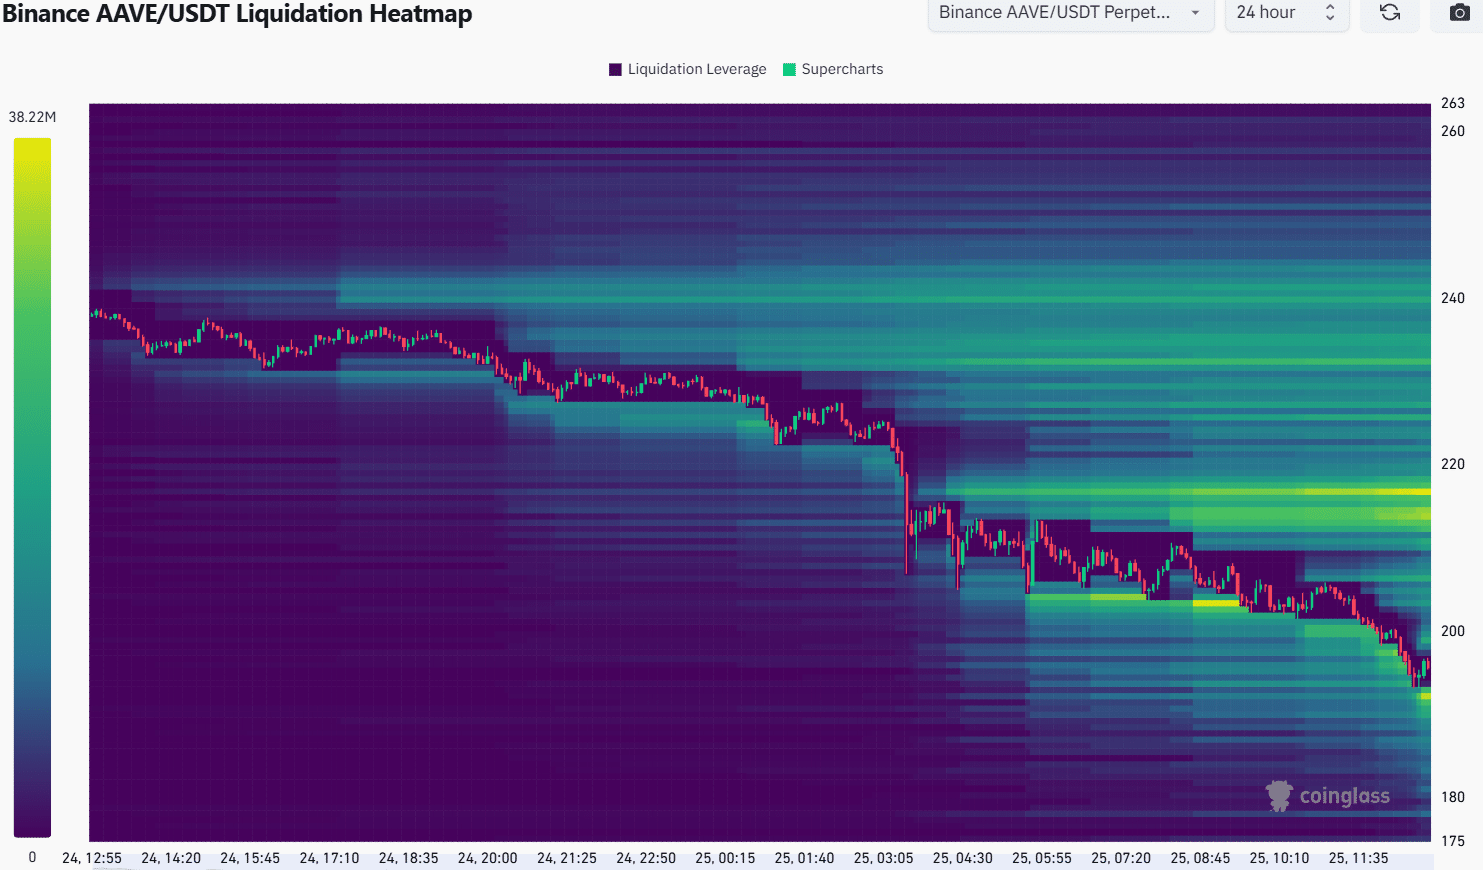
Source: Coinglass
In the short term, the $192 and $216 levels are interesting. They saw a cluster of liquidation levels build up over the past 24 hours.
The 2-day and 3-day AAVE liquidation heatmaps also highlight this level as the closest liquidity cluster to the north, with the next sizable one at $270.
Volatility was on the rise, at press time, and prices are generally attracted to liquidity. Hence, traders should beware of a 12% AAVE price bounce to $216 to sweep the liquidity before the downward move resumes.
Disclaimer: The information presented does not constitute financial, investment, trading, or other types of advice and is solely the writer’s opinion