
- AAVE continued to rally at press time, with the RSI at 74 pointing toward surging buying activity.
- The price has broken out of the double bottom formation, with the next key resistance level at $154.
Aave [AAVE] has extended its 37% weekly rally to trade at $136 at the time of writing, according to CoinMarketCap. Trading volumes have also increased by 20% in the last 24 hours.
The gains come amid growing market interest and buying activity around AAVE. Whales are already making waves around the token, having bought over $8M worth of AAVE in recent hours.
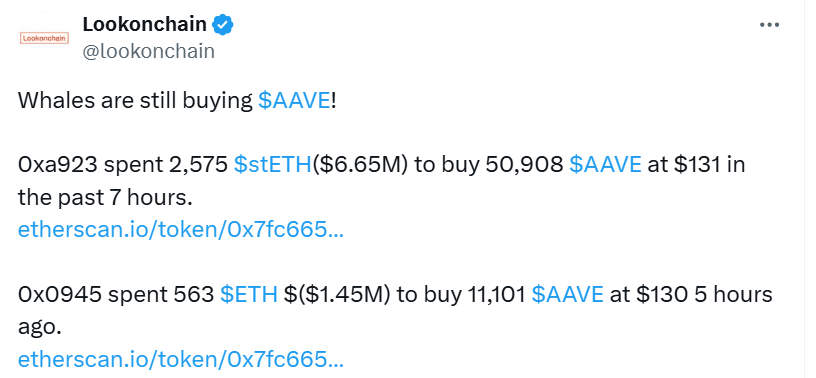
Source: X
Analyst Daan Crypto, on X (formerly Twitter), noted that this might be the time to pay attention to AAVE as the price shows signs of breaking past the 2.5-year range.
So, is AAVE ripe for more gains?
Looking at technical indicators
A look at AAVE’s price movement since dropping to a two-year low in June 2022 shows that it has broken past key resistance levels.
AAVE has tested the 0.618 Fibonacci level of $112 twice and held the price above this zone.
The token has also tested another key resistance at $130, and if it breaks through, the next target will be a two-year high at $154.
Since dropping from the March 2024 highs, AAVE has made a double-bottom formation. This is usually a bullish reversal pattern preceded by a significant rally.
The token has also broken above the neckline of the double bottom pattern, paving the way for a rally to $154.
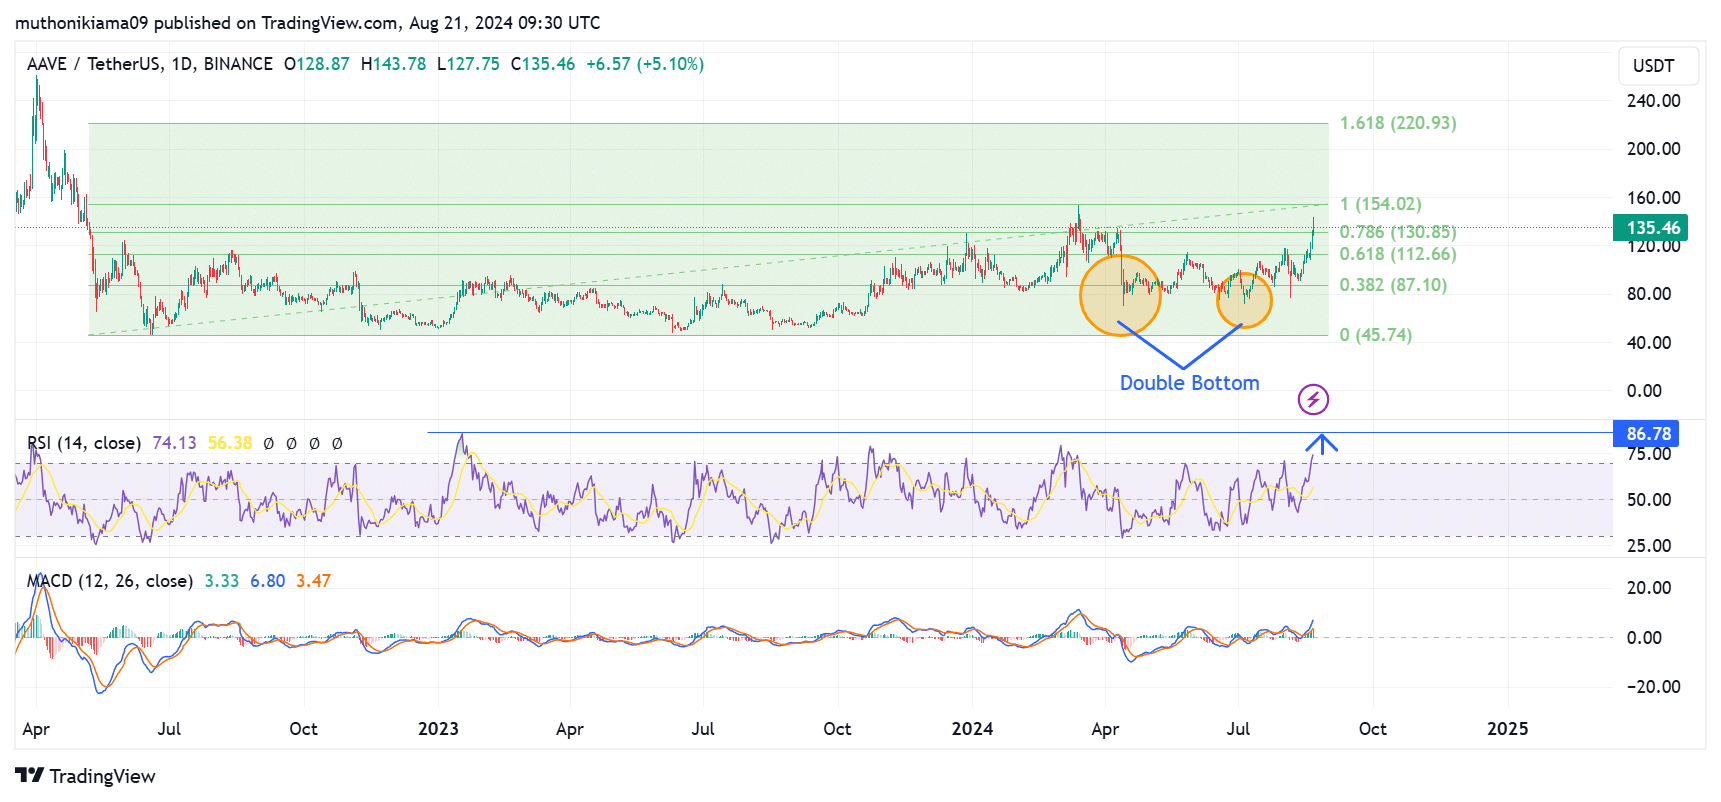
Source: TradingView
The Relative Strength Index (RSI) at 74 indicated that strong buying pressure was behind AAVE’s rally.
While the RSI is headed towards overbought regions, there is still room for more gains before a potential correction. The RSI peaked at 86 during previous rallies before short-term traders took profits.
The Moving Average Convergence Divergence (MACD) line is above the signal line, which is also bullish. The MACD histogram bars have grown longer since the 15th of August, reflecting stronger bullish sentiment.
As long as the MACD histogram bars grow longer on surging buying activity, the rally is likely to continue.
More bullish signals for AAVE?
Data from Santiment showed that the number of daily active AAVE addresses has reached the highest levels since July 2023.
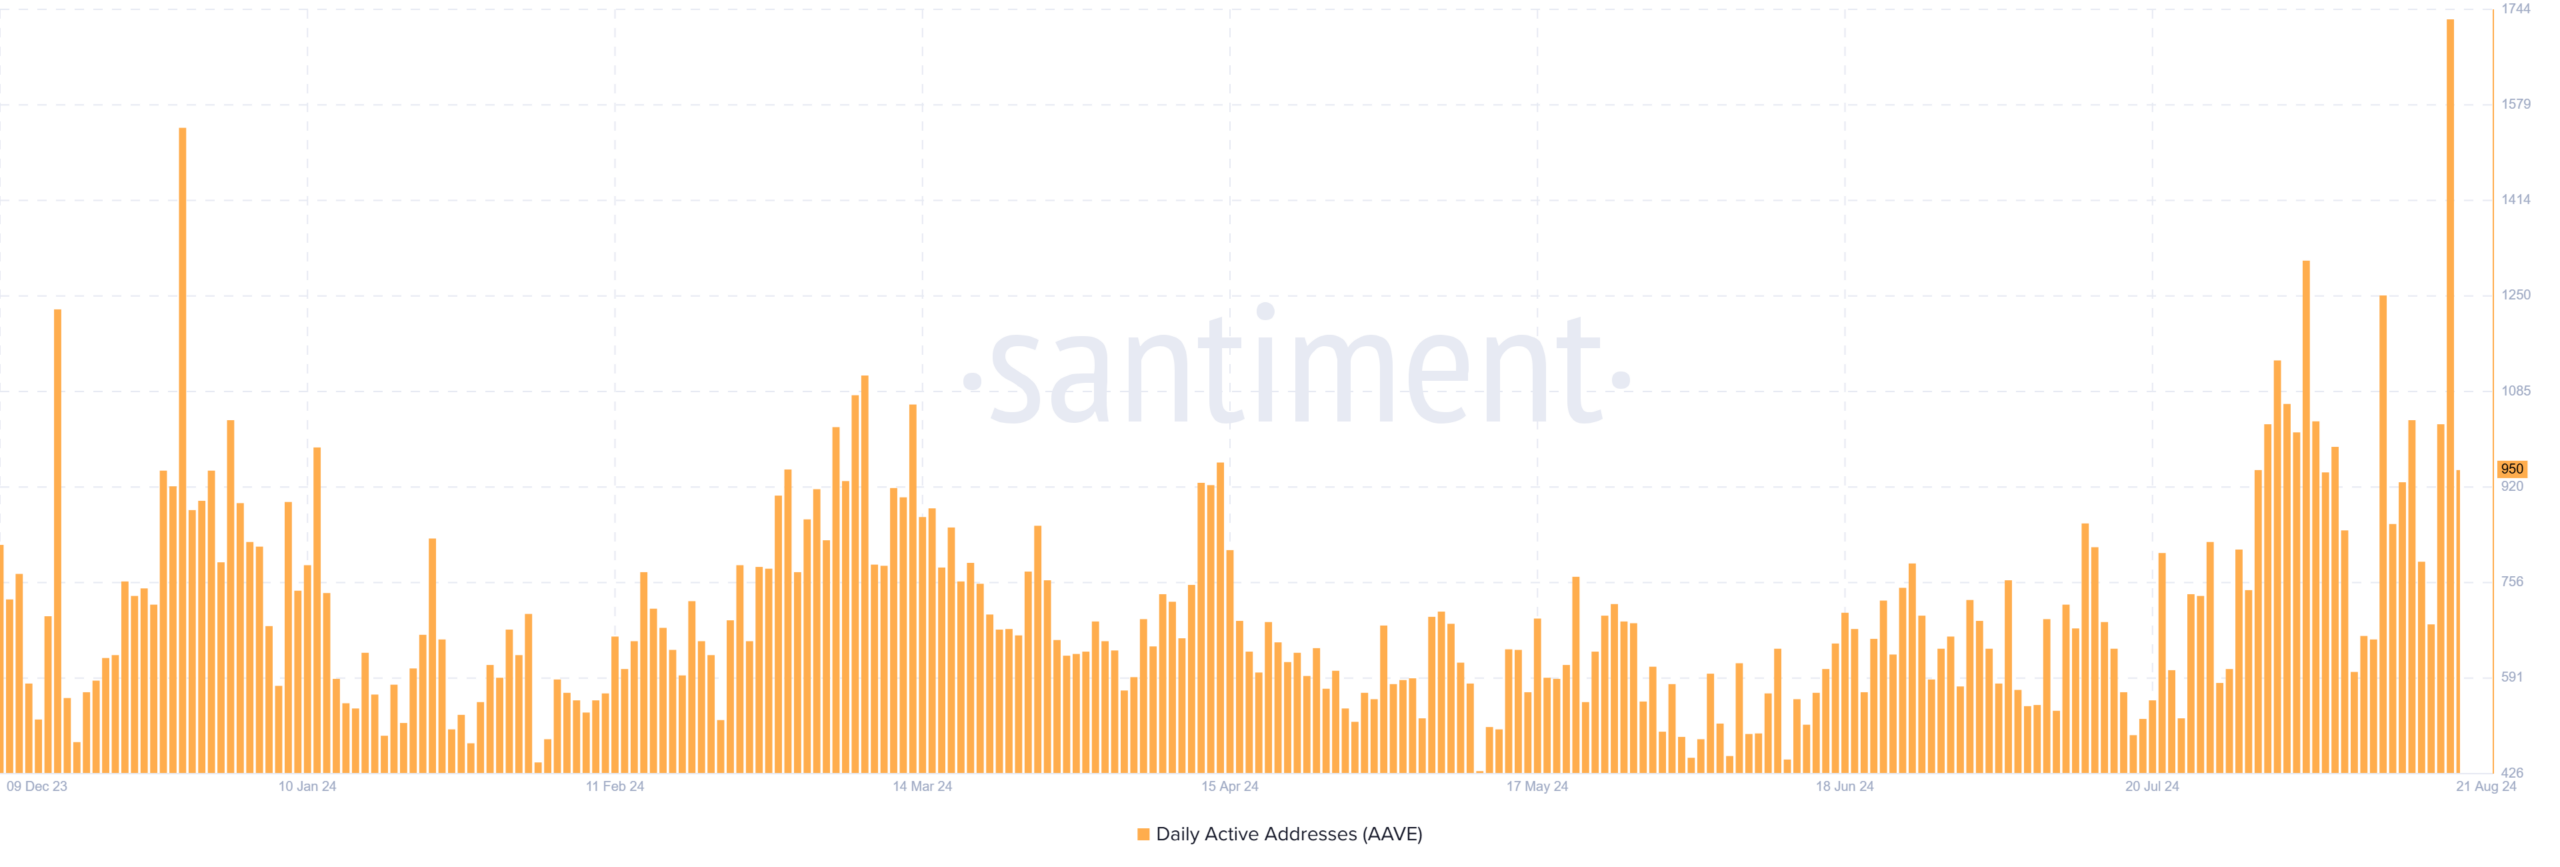
Source: Santiment
Realistic or not, here’s AAVE’s market cap in BTC’s terms
This is a bullish indicator, which signaled increasing demand around the token and rising market interest.
AMBCrypto’s look at Coinglass data also showed that AAVE’s Open Interest had soared to the highest level since 2021. Since the 1st of August, OI has surged from $93 million to $191 million at the time of writing.