- AAVE has a bearish structure and neutral momentum.
- Short-term holders likely added to the price drop with profit-taking activity, and accumulation has not resumed yet.
Aave [AAVE] was in a good position in the DeFi sector and could handle decentralized liquidations effectively. This earned a $6 million revenue overnight.
The protocol also saw milestones in July, such as the proposed introduction of a “fee switch.”
On the price front, AAVE appeared to be holding strong despite market-wide losses earlier this month. This idea was tossed out of the window during the sell-off on Monday the 5th of August.
What are the prospects for the token from here on?
AAVE retains bearish promise
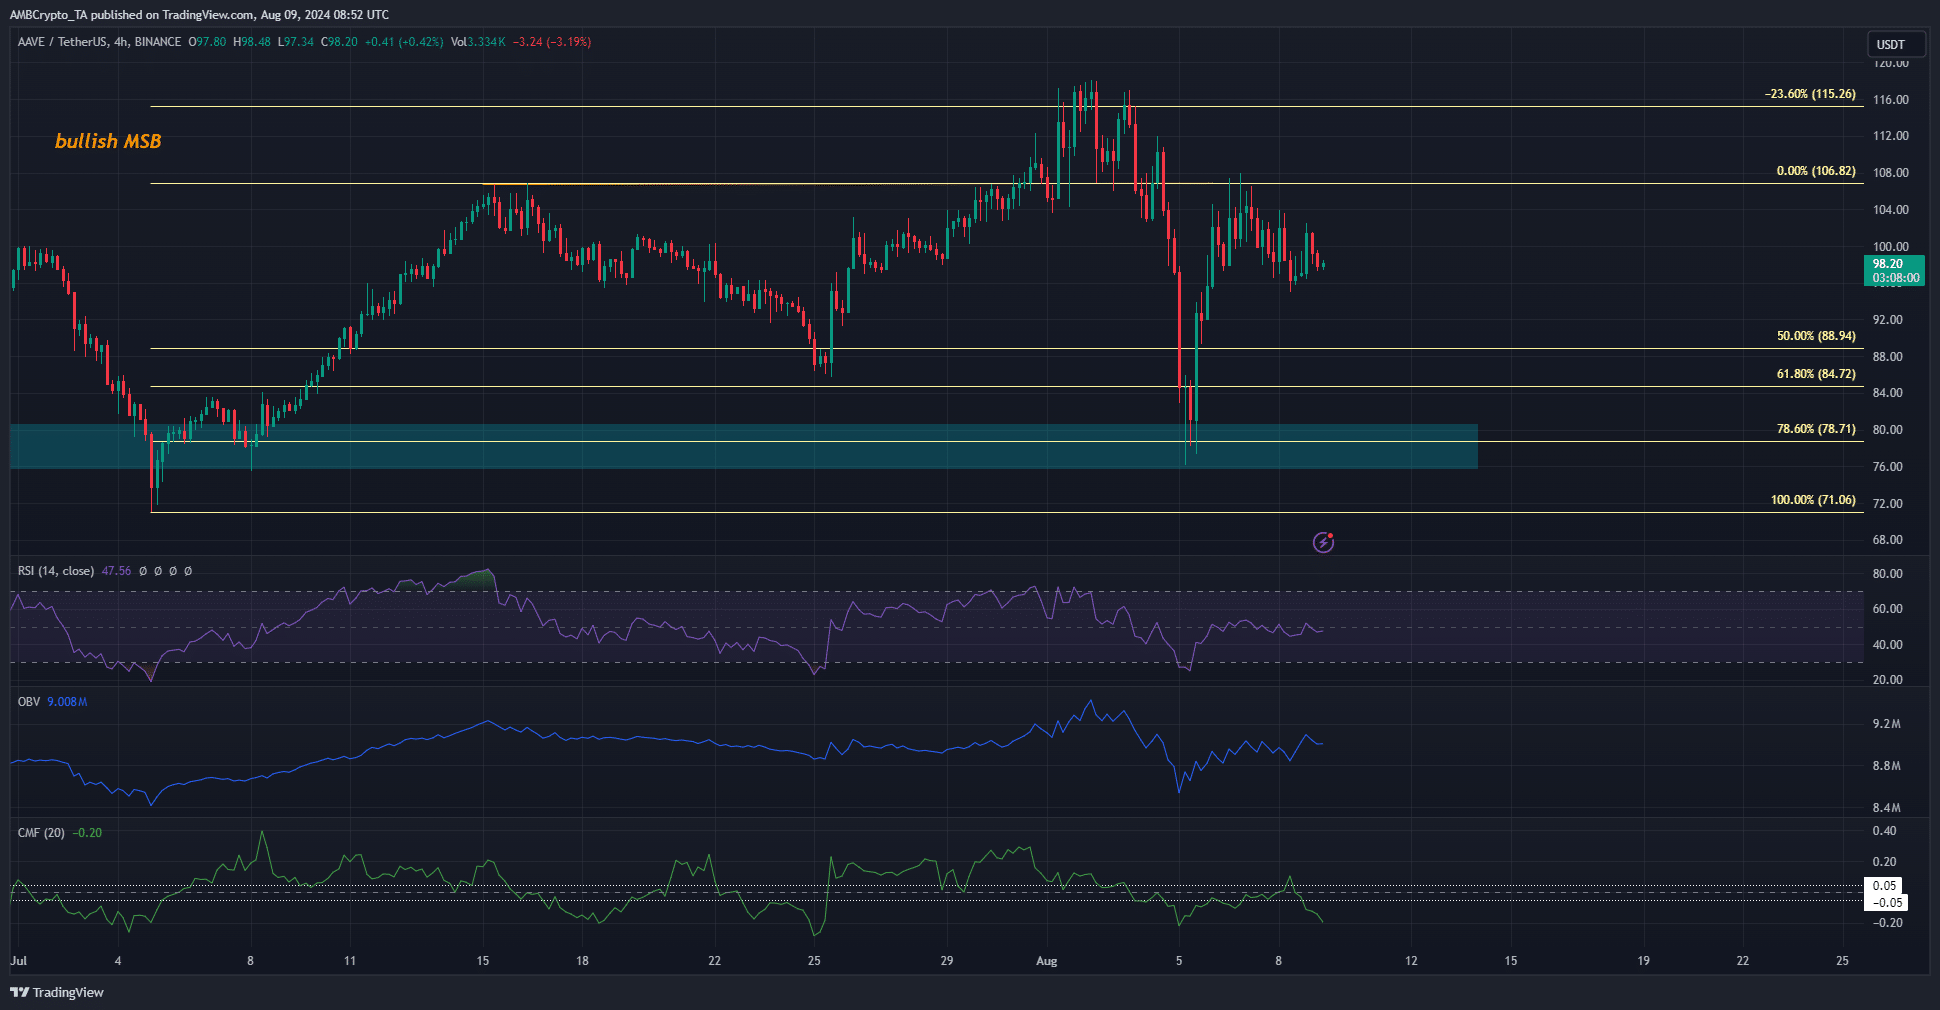
Source: AAVE/USDT on TradingView
The market structure of AAVE remained bearish on the 1-day chart. It fell to the 78.6% Fibonacci retracement level at $78.71 and bounced to the $106 level.
However, it could not make a new high, and the rejection set a lower high instead.
The daily RSI has meandered about the neutral 50 mark over the past few days, showing the momentum did not favor the bulls yet.
The OBV has trended upward since the 5th of August, but the CMF fell to -0.2 to signal heavy capital flow out of the market.
AAVE metrics signaled volatility and distribution
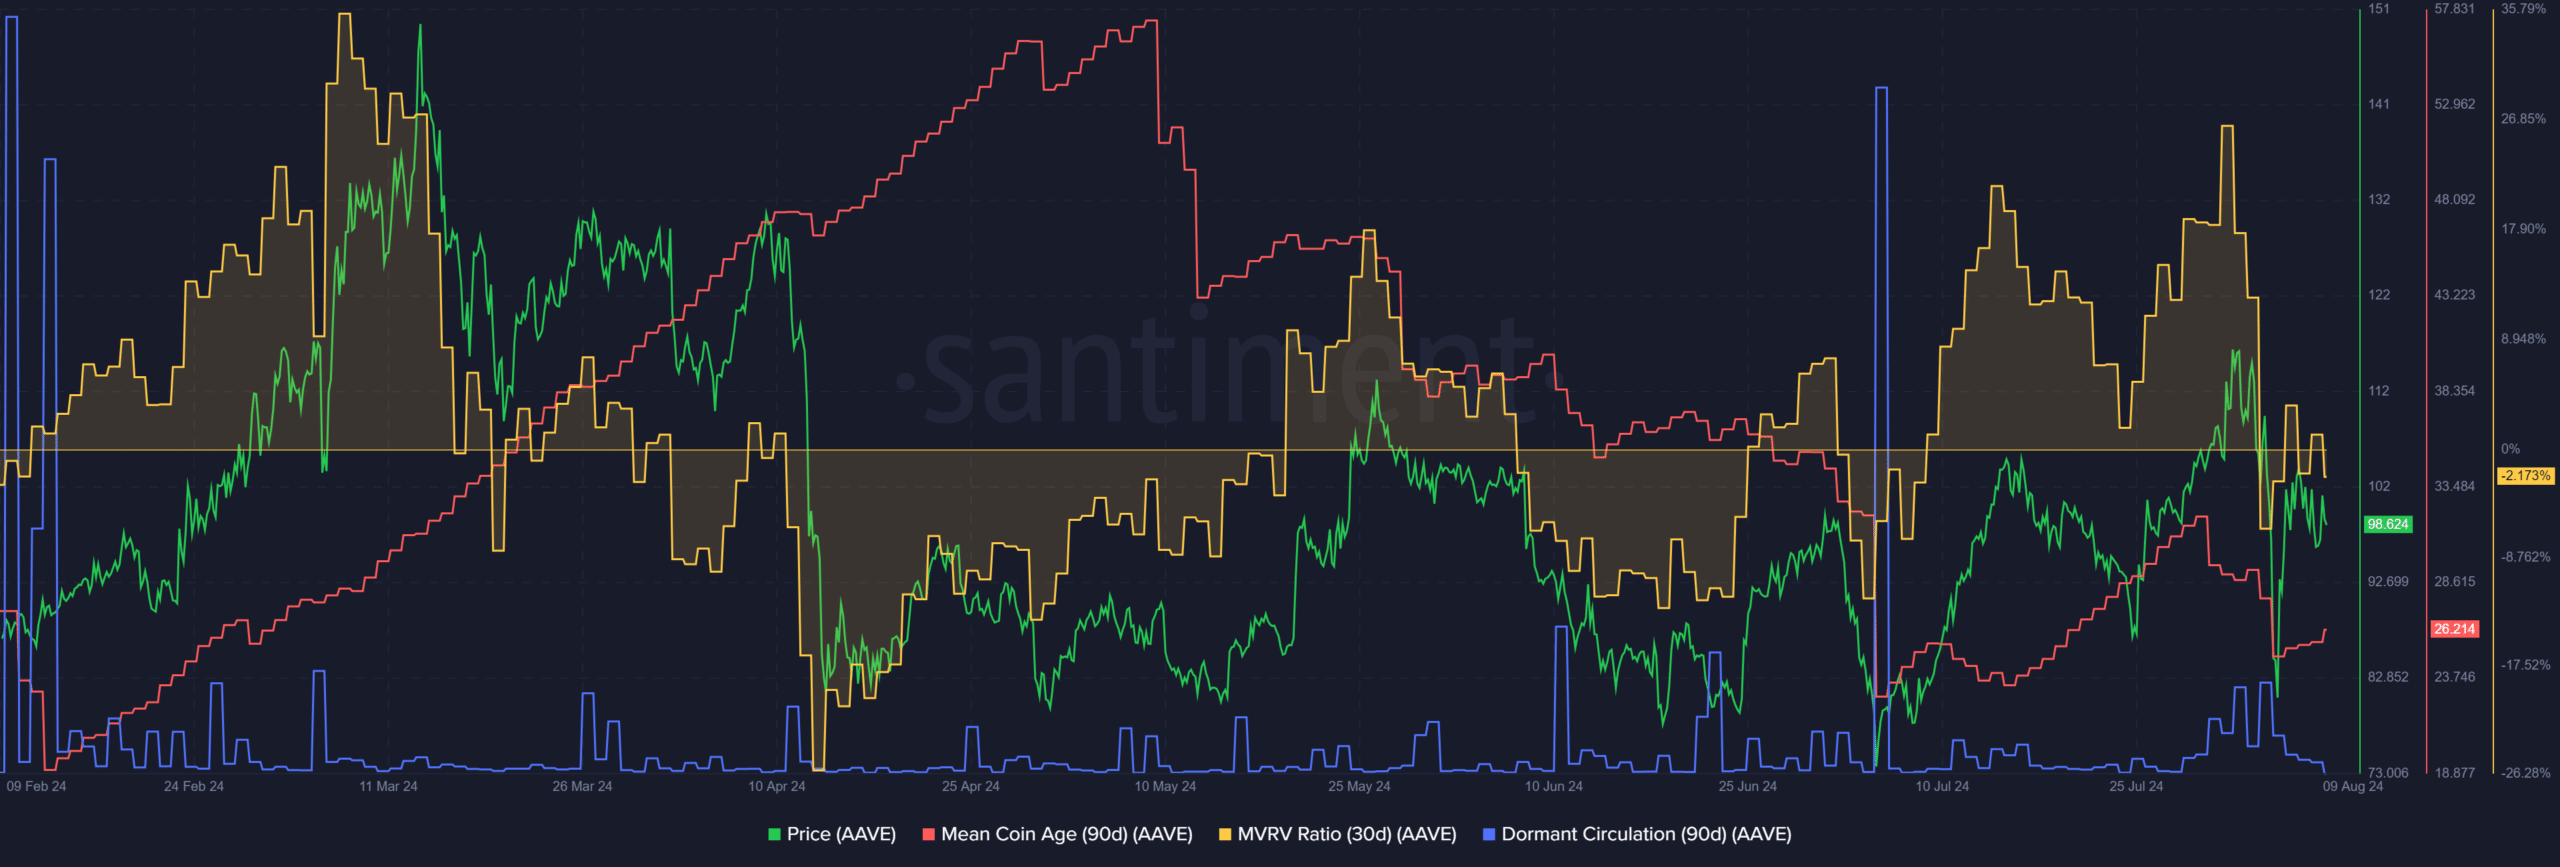
Source: Santiment
The MVRV ratio fell from nearly 30% to -2%, showing short-term holders were at a profit before the price crashed below $100. During the price drop, the dormant circulation saw an uptick.
Together, it indicated holders cashed out and likely took profits. This idea was supported by the fall in the mean coin age (MCA) too, which showed an AAVE distribution.
The MCA would need to trend higher to signal buyers were accumulating the token.
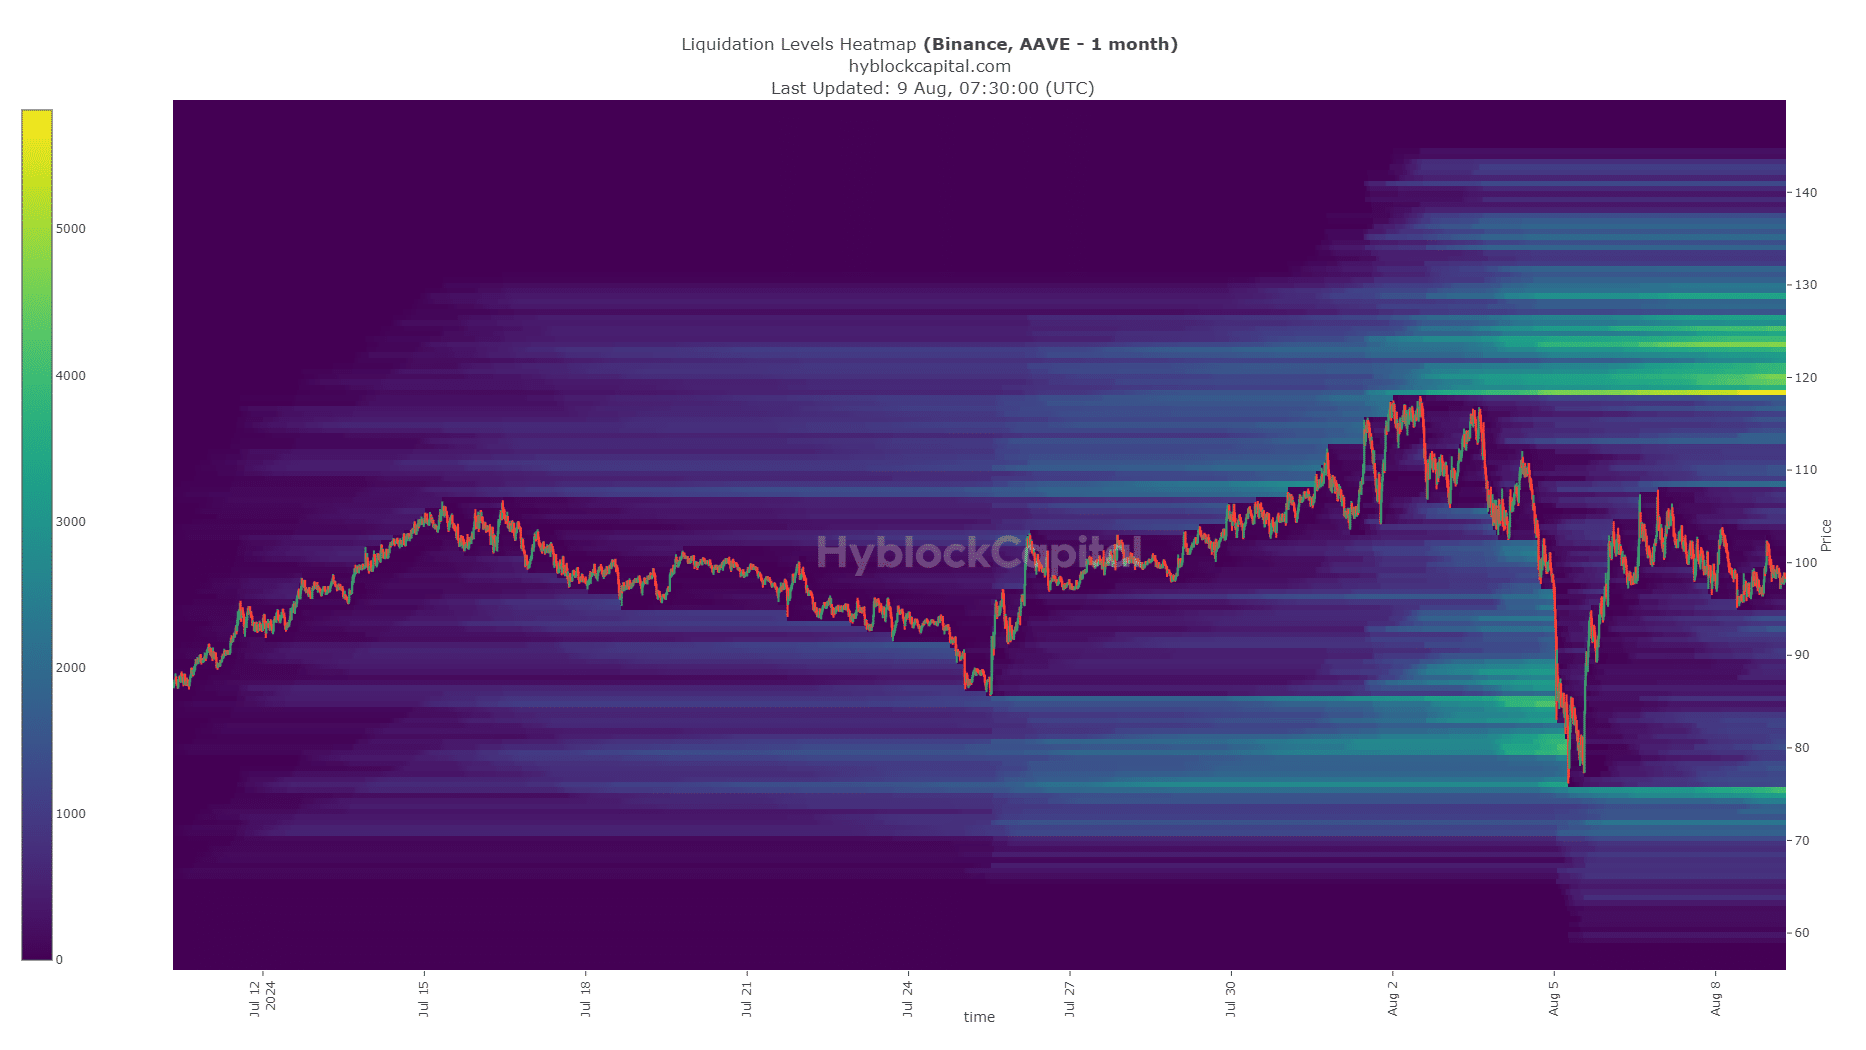
Source: Hyblock
The liquidation heatmap underlined a short-term target at $108.5, and a much stronger liquidity pool at $118-$120. This could serve as a near-term target for the AAVE token before a pullback.
Realistic or not, here’s AAVE’s market cap in BTC’s terms
Overall, the show of relative strength against Bitcoin [BTC] was quickly annihilated, which did not bolster investor confidence.
Yet, the performance of the protocol during this network stress period was positive and could reflect in AAVE prices once the market sentiment begins to shift.