AAVE price prediction – Will it fall to $50 after rejection at $78-level?
Profit-taking and the bearish long-term structural implication were signs that AAVE would decline toward $50 in the coming weeks.

Aave [AAVE] was one of the tokens that saw a strong bounce earlier this month following a sharp price crash at the start of June. The AAVE recovery measured 34.86% from the $57.83 low to the $77.99 local high. The size of this bounce should not confuse investors into thinking that a recovery is imminent.
Based on the price action, further bearish continuation appeared likely. Such a continuation may have already begun over the past 24 hours. The DeFi token shed 5.74% in 24 hours, and its daily trading volume was up 23%. Additionally, the Open Interest has crept lower by 6.20%.
Together, the volume signs point toward intensifying selling pressure. Examining longer-term price trends can help explain why AAVE is likely to trade at lower levels in the coming weeks.
Reasons why AAVE bears are in control
Recently, AMBCrypto reported a Grayscale Research prediction that Aave could trade at $175. The report suggested that the token was currently fairly priced based on the conventional discounted cash flow [DCF] analysis.
However, in the scenario where regulatory clarity accelerates tokenized asset adoption, AAVE’s price could go to the aforementioned target.
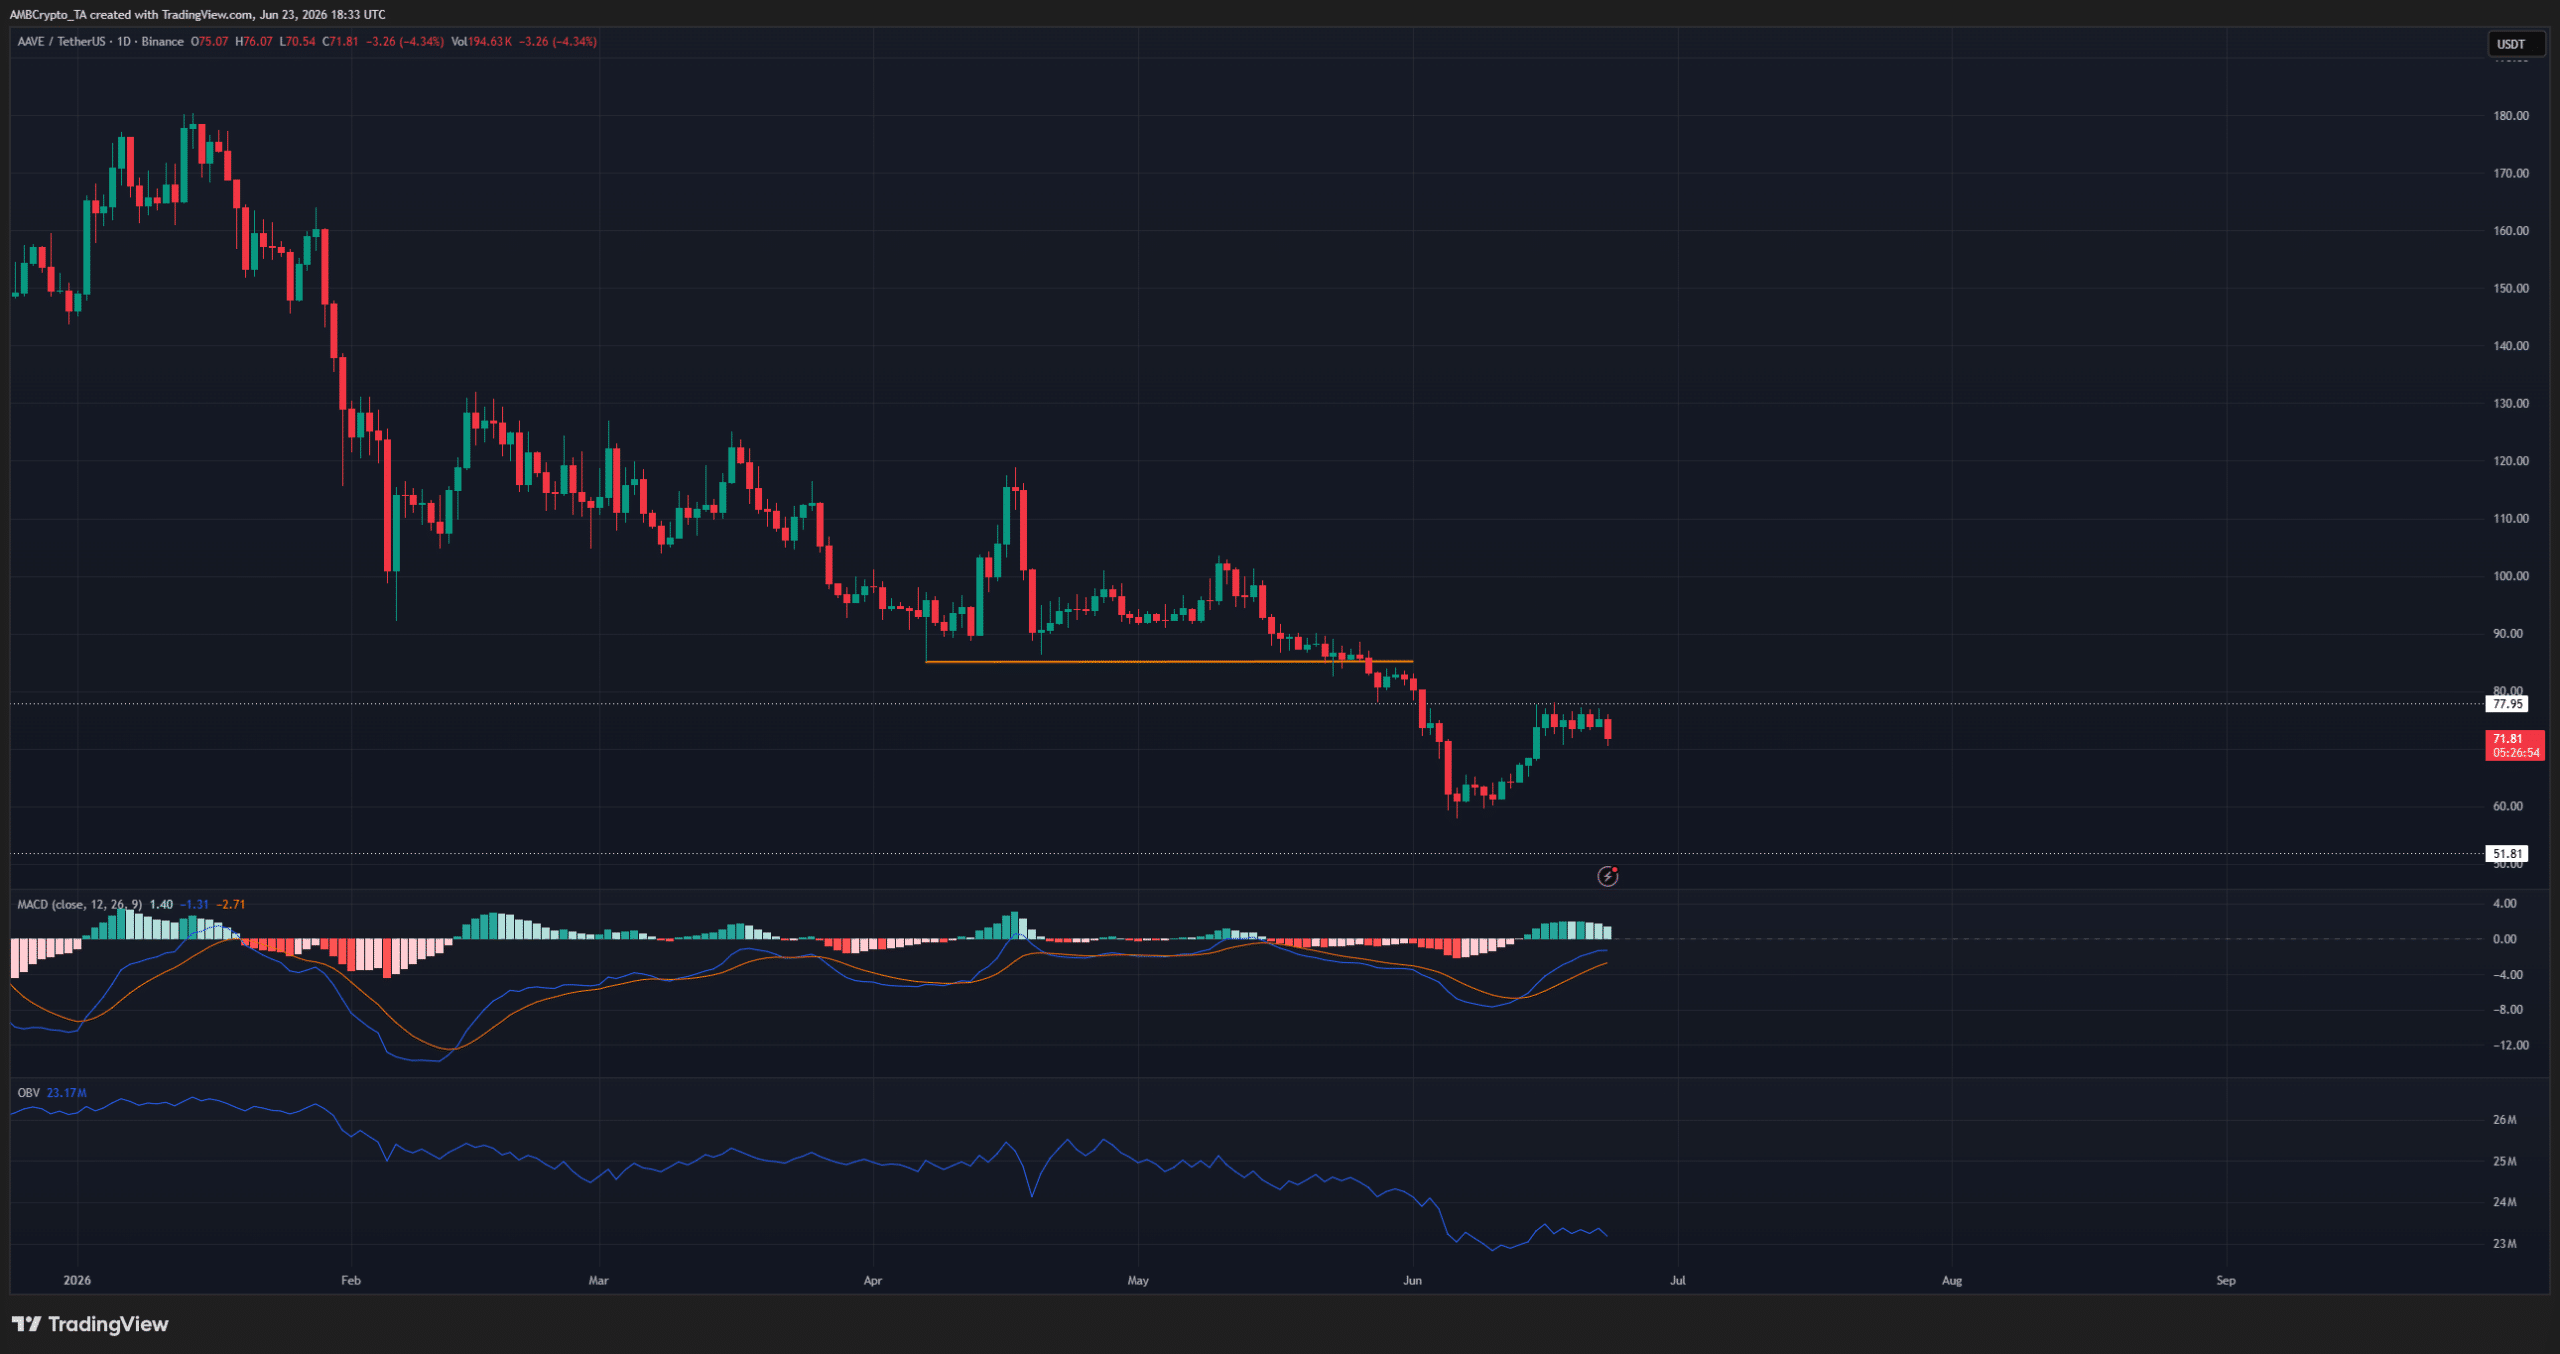
The price structure was bearish on the 1-day timeframe after breaking the $85.05 low toward the end of May [orange]. The OBV has been in a downtrend in 2026, with some gains made in April and May. This indicated a brief spurt of buying, but not enough to change the long-term trend.
The $77.95 and $51.81 levels were key horizontal ones from the previous cycle. They served as support back in 2023 and 2024, but the former was tested as resistance in recent days. AAVE faced rejection at $78 and is likely to go towards $50 next.
Traders’ call to action- Sell
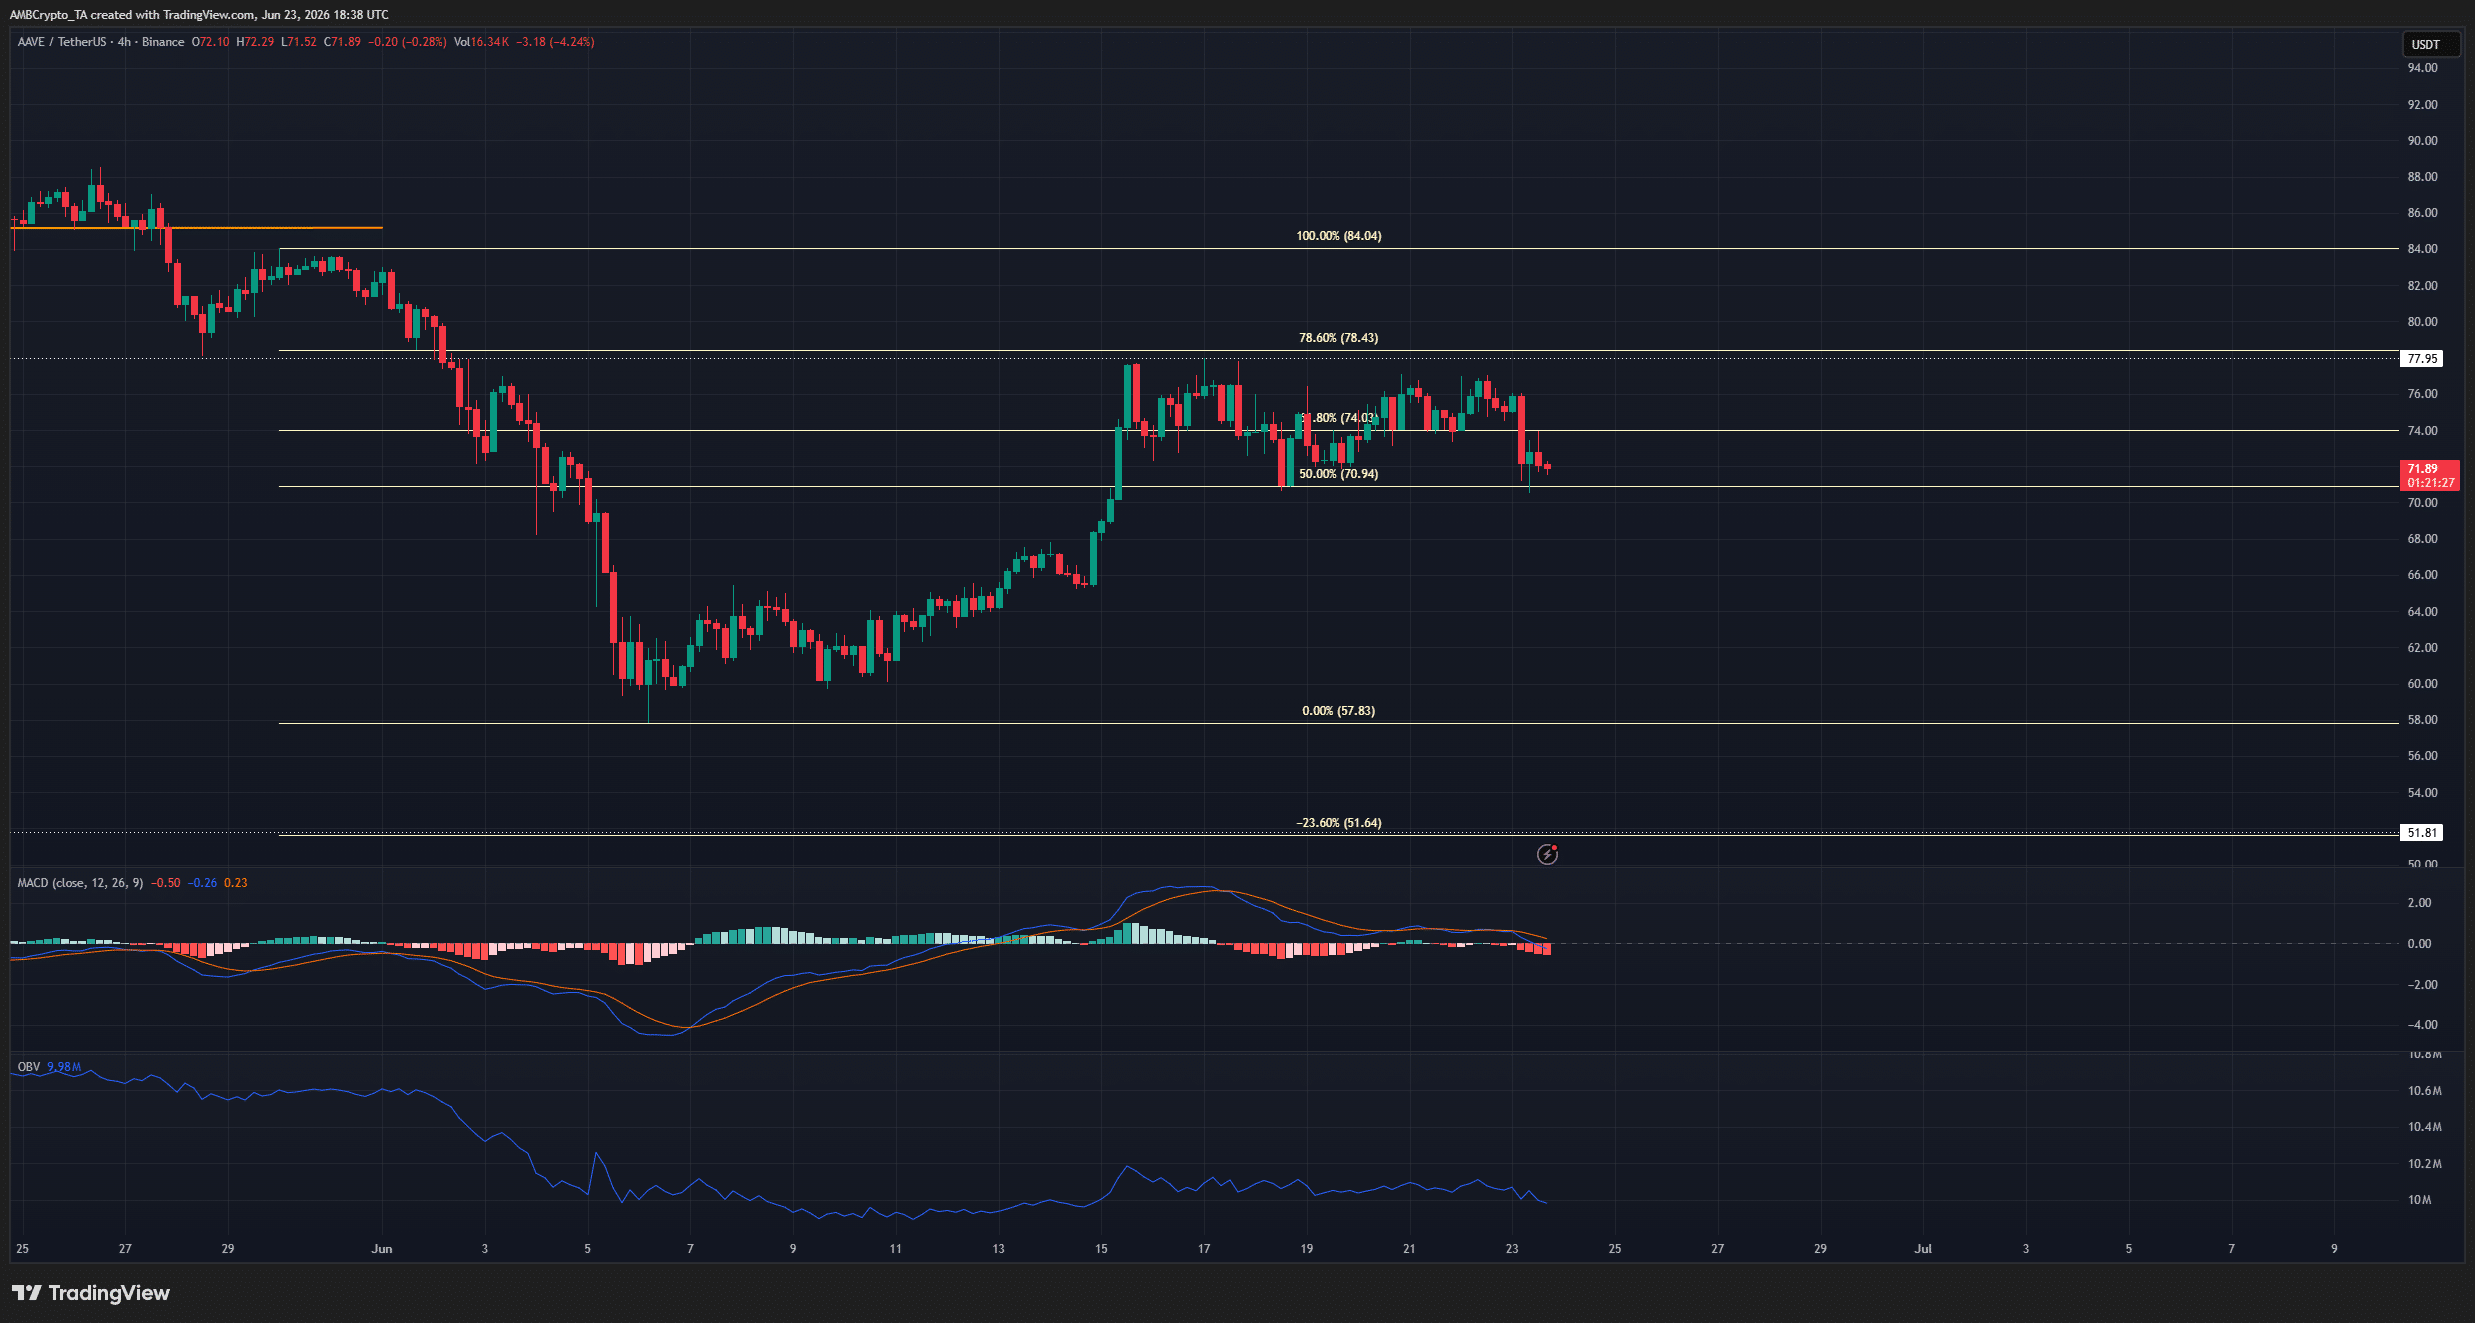
The Fibonacci retracement level at $78.43 coincided nicely with the weekly horizontal level, as does the 23.6% southward extension level at $51.64. As things stand, these are the price levels to watch based on the 4-hour chart.
The sustained downtrend, combined with the rejection from $78, meant a move toward $50 can be expected.
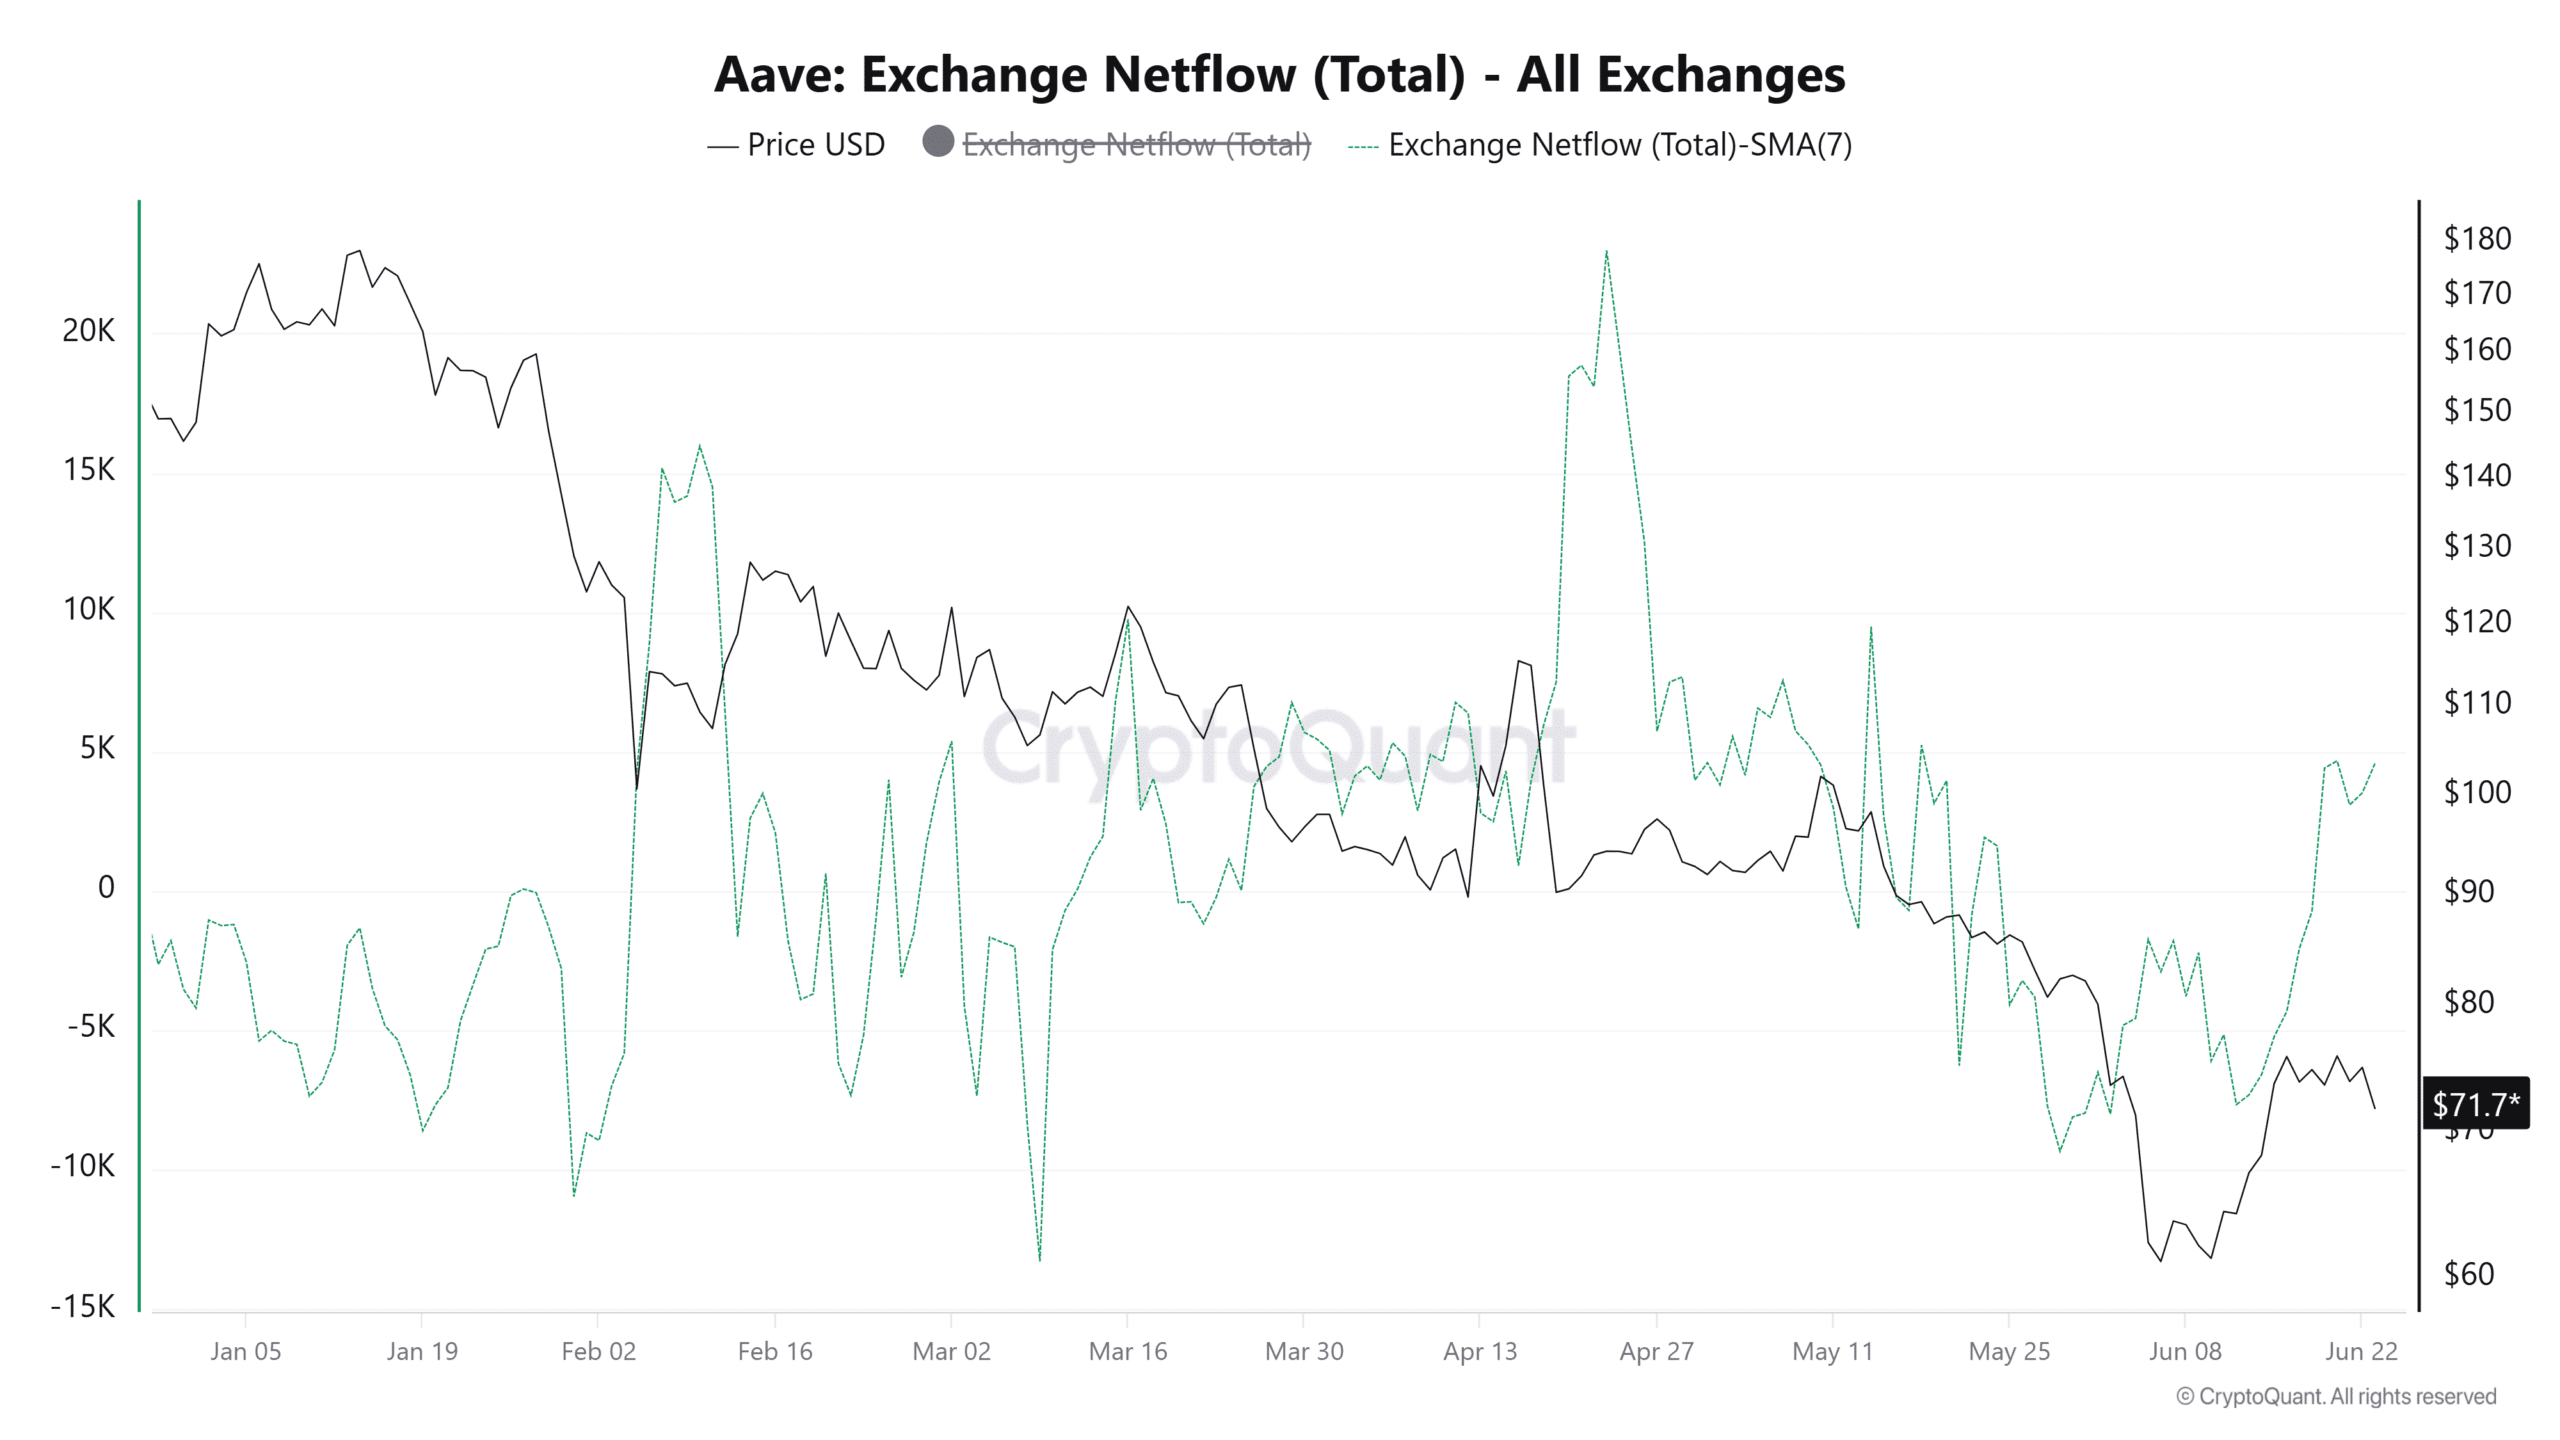
CryptoQuant data showed a positive shift in the 7-day moving average of exchange netflows. This indicated increased inflows as Aave token prices bounced to $78, signaling an intent to sell from the holders.
Final Summary
- A support level that served as the launchpad for the 2024 price rally has just been retested as resistance.
- Profit-taking and the bearish long-term structural implication were signs that AAVE would decline toward $50 in the coming weeks.


