AAVE slips below a former support zone, here’s how much lower it can go

Disclaimer: The information presented does not constitute financial, investment, trading, or other types of advice and is solely the writer’s opinion.
- $73 flipped to resistance
- Bitcoin is unable to rally past $19.6k as well
At the time of writing, Aave had a market capitalization of $1 billion. The lending platform was among the biggest in the DeFi sector with a TVL of $3.7 billion. The past week saw the token’s social activity soar, but the price did not show a bullish trend in the same period.
Here’s AMBCrypto’s Price Prediction for Aave [AAVE] in 2022
The price charts showed a rather bearish storm brewing behind AAVE. In September, AAVE grappled with the $96 resistance mark. In October, the nemesis was $80. It appeared likely that AAVE could post another leg downward.
Buyers were exhausted despite the strong bounce at $66
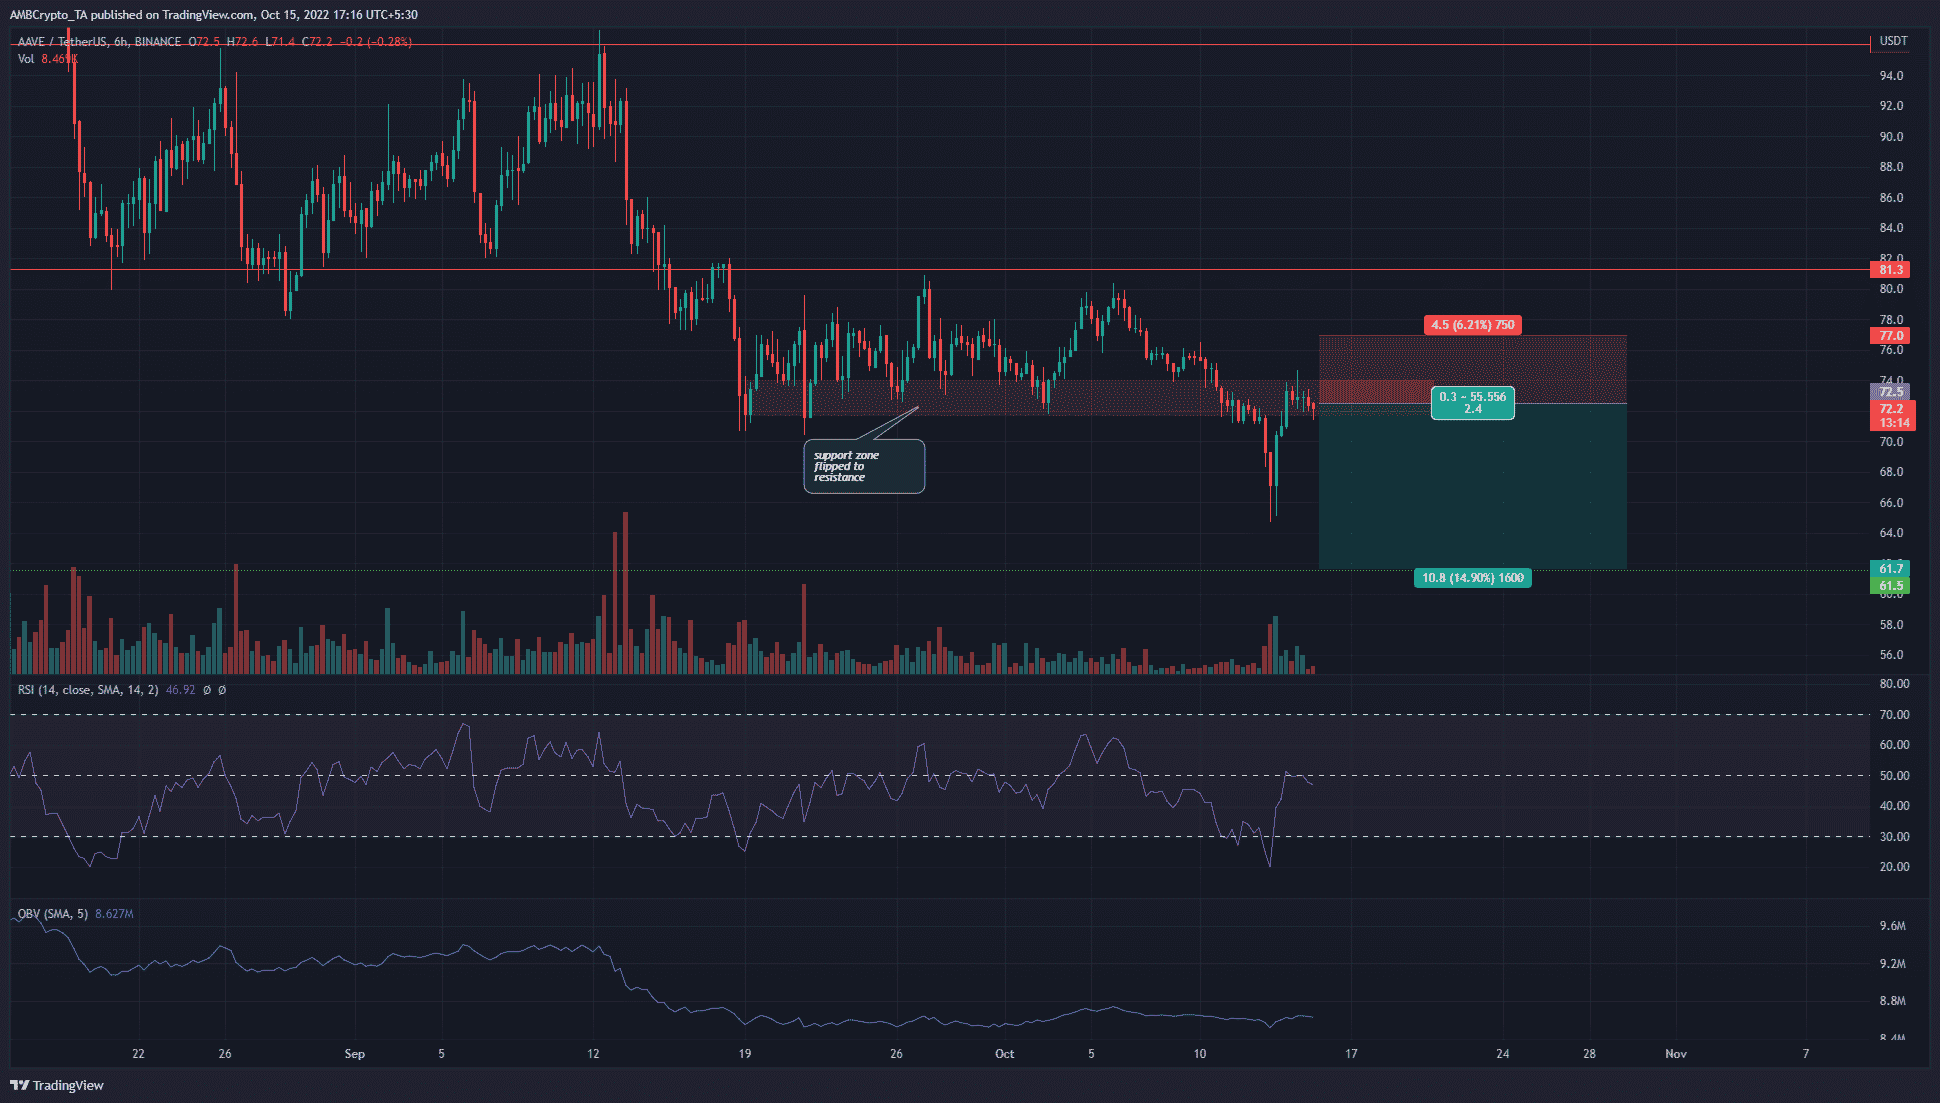
The support zone at $72 had been held since mid-September. Numerous attempts by the bears to break past this zone were met with a wall of buyers. However, over time this wall began to crack. At the same time, the price was unable to climb past $80. The $81 level of resistance was not beaten, and AAVE had a higher timeframe bearish market structure as well.
The higher timeframe charts suggested that sellers remained dominant. Therefore, it was the bounce back to the $72 zone that traders can look to sell. The Relative Strength Index (RSI) agreed as it stood below neutral 50 to show some bearish momentum. The On-Balance Volume (OBV) has remained flat as well to denote a balance between buying and selling volume.
A retest of $74 would likely be followed by another move lower. $66.3 and $61.5 are important support levels to the south. This bearish idea would be invalidated should the token close a trading session above $76.
Development activity on the rise despite downtrend
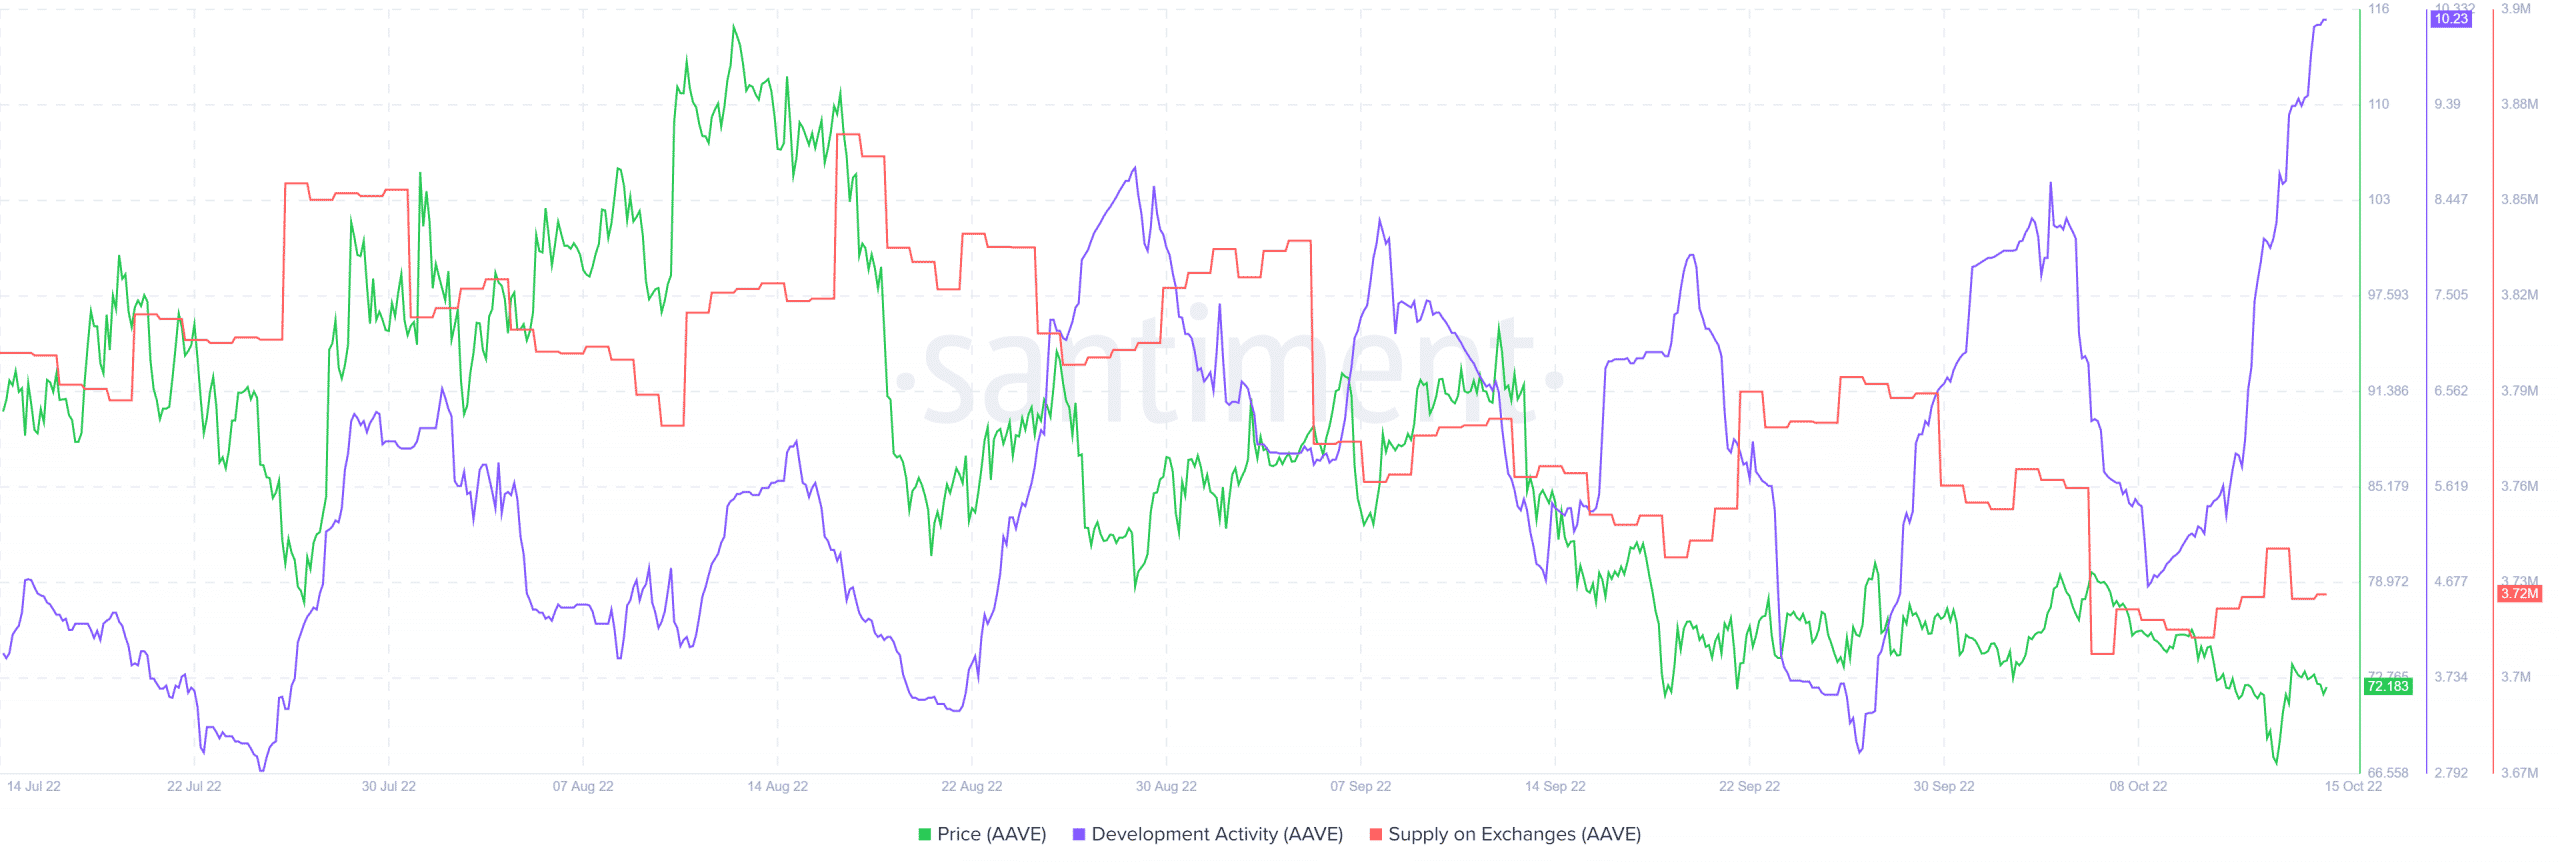
Long term investors can take heart in the fact that development activity did not see a fall despite the price’s downtrend. A surprising factor was the reducing supply of AAVE on exchanges despite the strong downtrend.
Taken together with the flat OBV, the metric suggested an accumulation of the token by larger market participants. This accumulation phase need not mean the bottom is around the corner, and AAVE might have see more losses on its price chart.