Aave, Tezos, Zcash Price Analysis: 11 June

Aave, Tezos, and Zcash, after undergoing a price fall on June 7, traded within a restricted range and clung close to their key support levels. The price action for these alts was low and the 7% rise in the total crypto-market cap did not show positive signs in the prices of these altcoins.
Tezos had over 283,000 transactions on June 9 which was a landmark number for the coin. Its price saw slight gains at press time on the four-hour chart with the emergence of a green candlestick. On the contrary, Aave and Zcash saw their prices fall by 11.8% and 10.4%, respectively, after June 10.
Aave [AAVE]

Source: AAVE/USD, TradingView
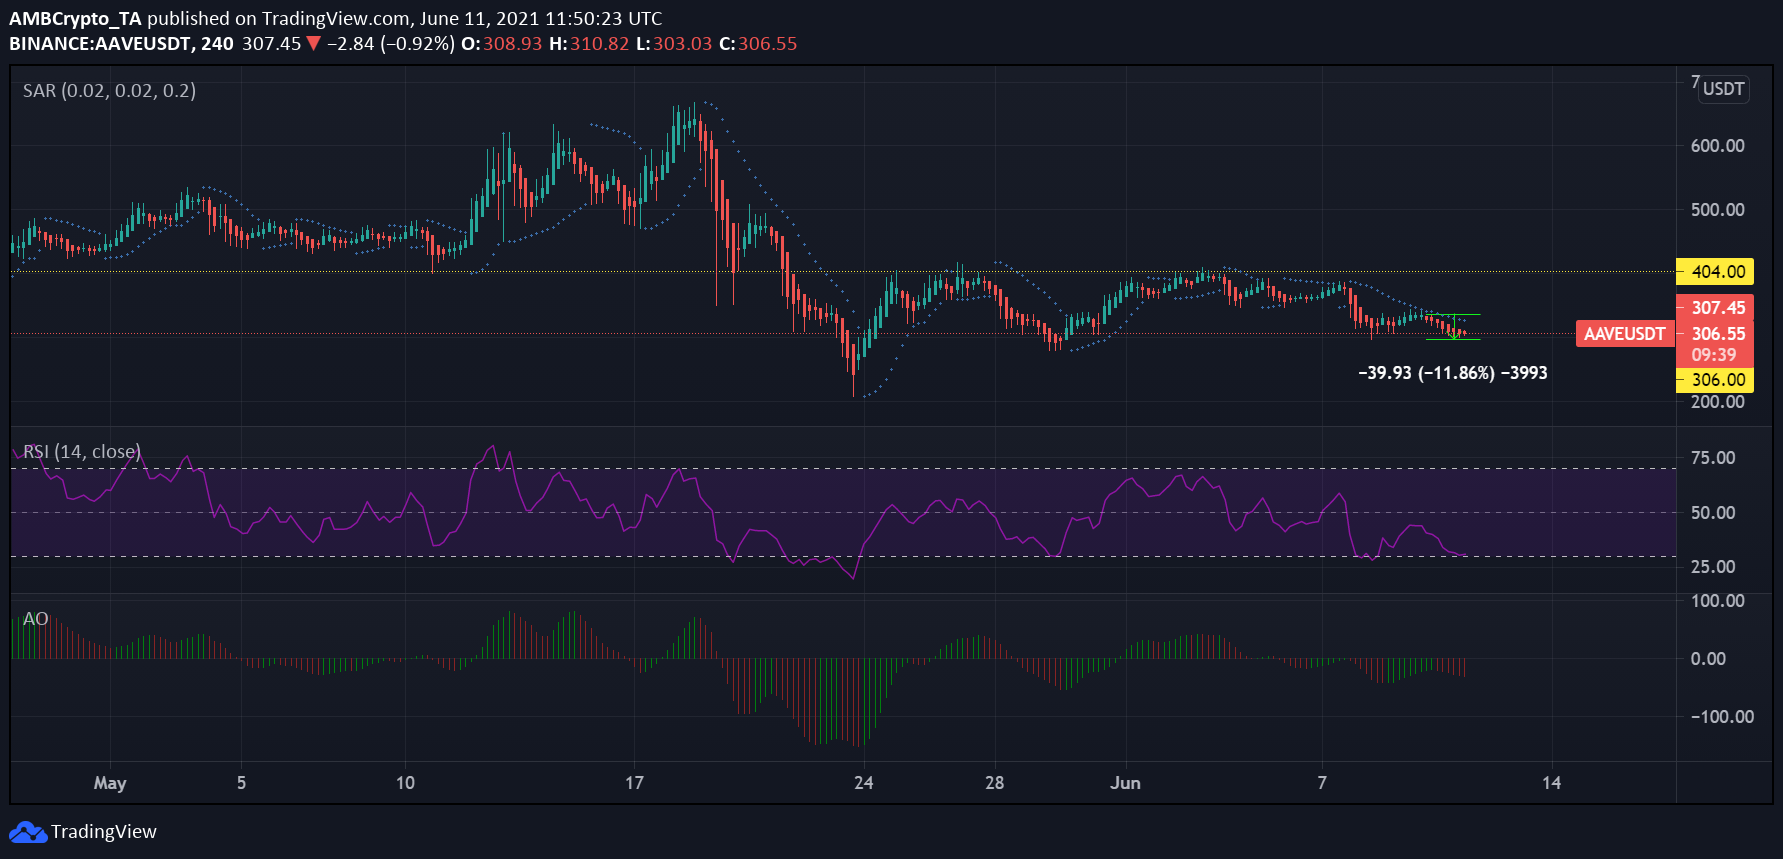
After the price drop on June 7 which caused Aave’s price to fall by almost 16.6%, the asset experienced slight recoveries before falling further from June 10. Aave ranked 28th on CoinMarketCap noted a one-day price fall of 5.89% and a seven-day price fall of 13.87%.
The Relative Strength Index for Aave was at 31m at press time, and any further fall would push the asset into the oversold zone. The indicator highlighted the dominance of selling pressure. However, the constant downtrend of the indicator had flattened somewhat and also noted a tiny uptick.
The Parabolic SAR’s dotted lines above the candlesticks highlighted bearish momentum. This bearish momentum had crept in on June 7 and has lingered since then. Furthermore, the Awesome Oscillator was under the zero-line and had increasing red bars which suggested that the bearish momentum was getting stronger.
The next key resistance for Aave was at $404 while its support was at $306, which the asset tested around press time.
Tezos [XTZ]

Source: XTZ/USD, TradingView
On the 4-hour timeframe, Tezos registered sideways movement as price action for the asset was low after the June 7 price dip. XTZ fluctuated between the $3.1 support and $4.1 resistance. At press time, the altcoin was trading at $3.3 and noted slight signs of price gain with the appearance of two green candlesticks.
The Bollinger Bands for the alt sharply converged on June 11, highlighting a constricted price range and low volatility. On the other hand, capital inflows remained healthy as the Chaikin Money Flow traded above the equilibrium mark and noted a sharp uptick.
Further, the MACD line ran close below the Signal line and indicated that a slightly bullish crossover could take place.
Zcash[ZEC]

Source: ZEC/USD, TradingView
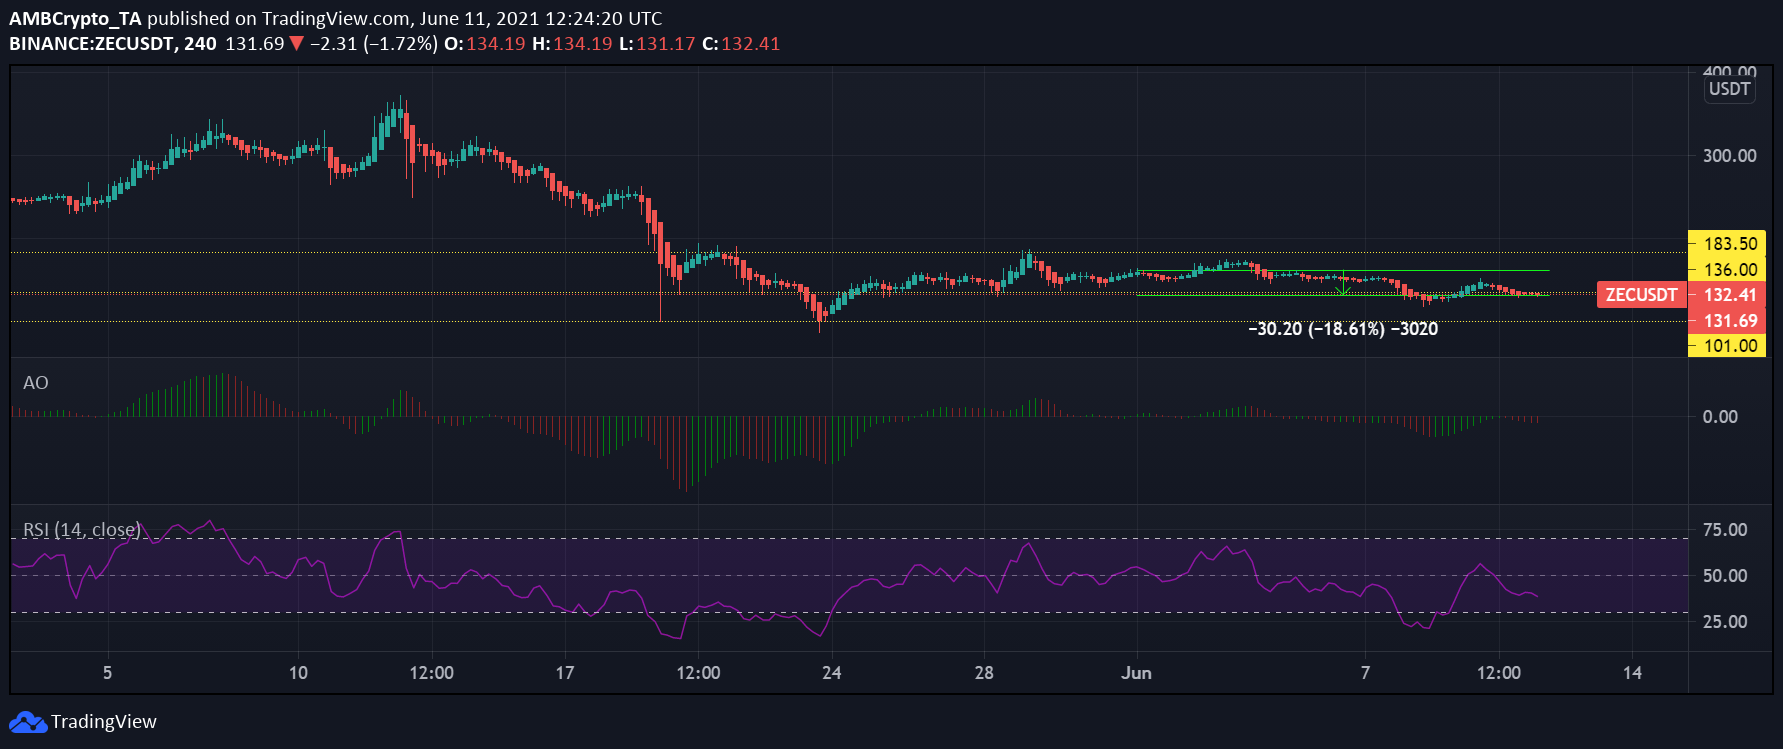
On a four-hour chart, Zcash oscillated between the $136 support and the $183.5 resistance. At press time, the alt had tested the $136 support level multiple times, and if it breaches the same, its next support could be found at $101.
Zcash was trading at around $132 at press time and was down 98.51% from its all-time high. The Awesome Oscillator was under the zero-line and the appearance of red bars on the indicator suggested that the bearish momentum was creeping in at press time.
The asset has seen an almost 18% price fall since the start of June and the Relative Strength Index for Zcash was in the neutral zone. However, the southward movement of the indicator at press time highlighted the dominance of selling pressure.


