AAVE’s road to $290 – Watch out for these on-chain metrics now!
The weekly market structure break six weeks ago was a sign of bullish intent, but the on-chain metrics weren't so.
- AAVE saw lackluster exchange netflows OVER the past month
- The weekly bullish market structure break was a powerful signal
Aave [AAVE] bulls have tenaciously defended the $140 support level over the past two months. However, the altcoin has a $200 target and is likely to go much further, based on the higher timeframe price charts.
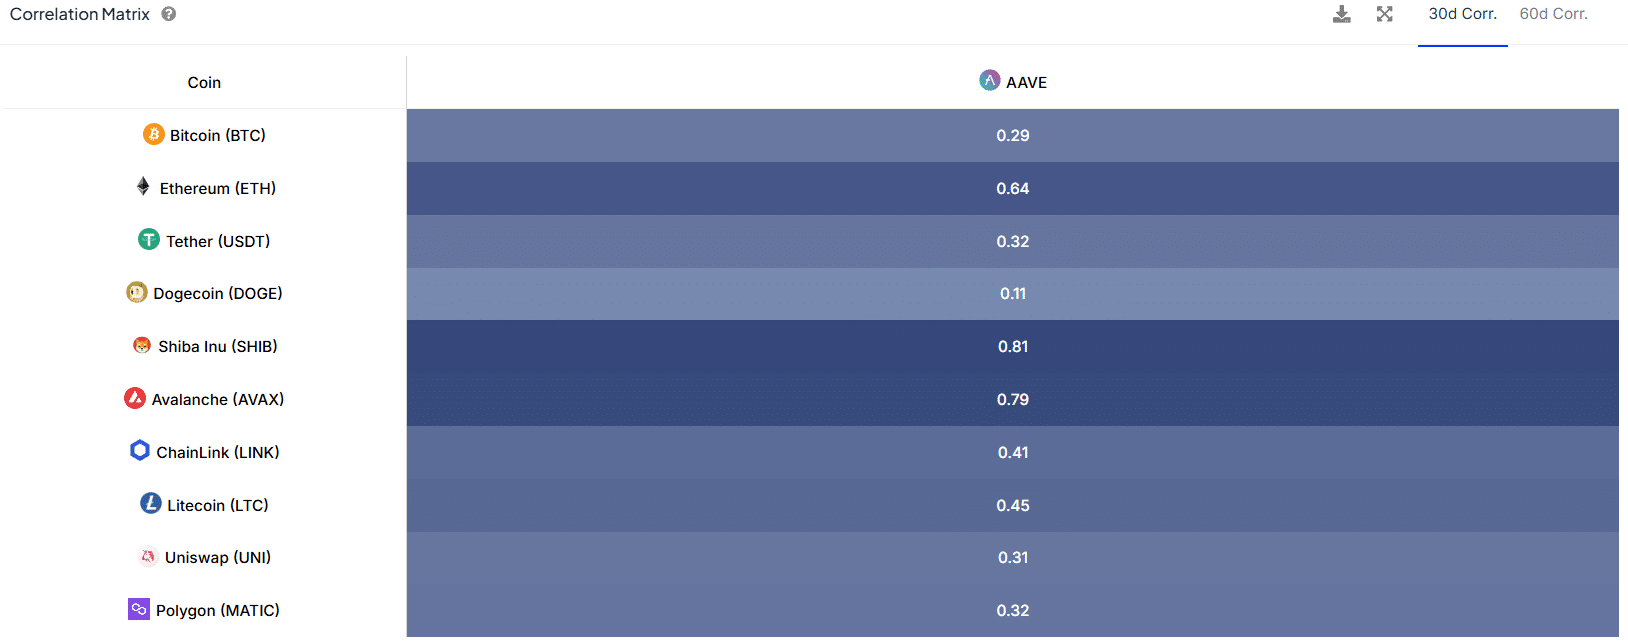
Its low 30-day correlation of +0.29 was not surprising though. While AAVE fought to defend $140 and reclaim $150 as support, Bitcoin has steadily trended higher over the past six weeks.
However, long-term investors have little reason to be dejected just yet.
Signs of a sustained uptrend are yet to present themselves
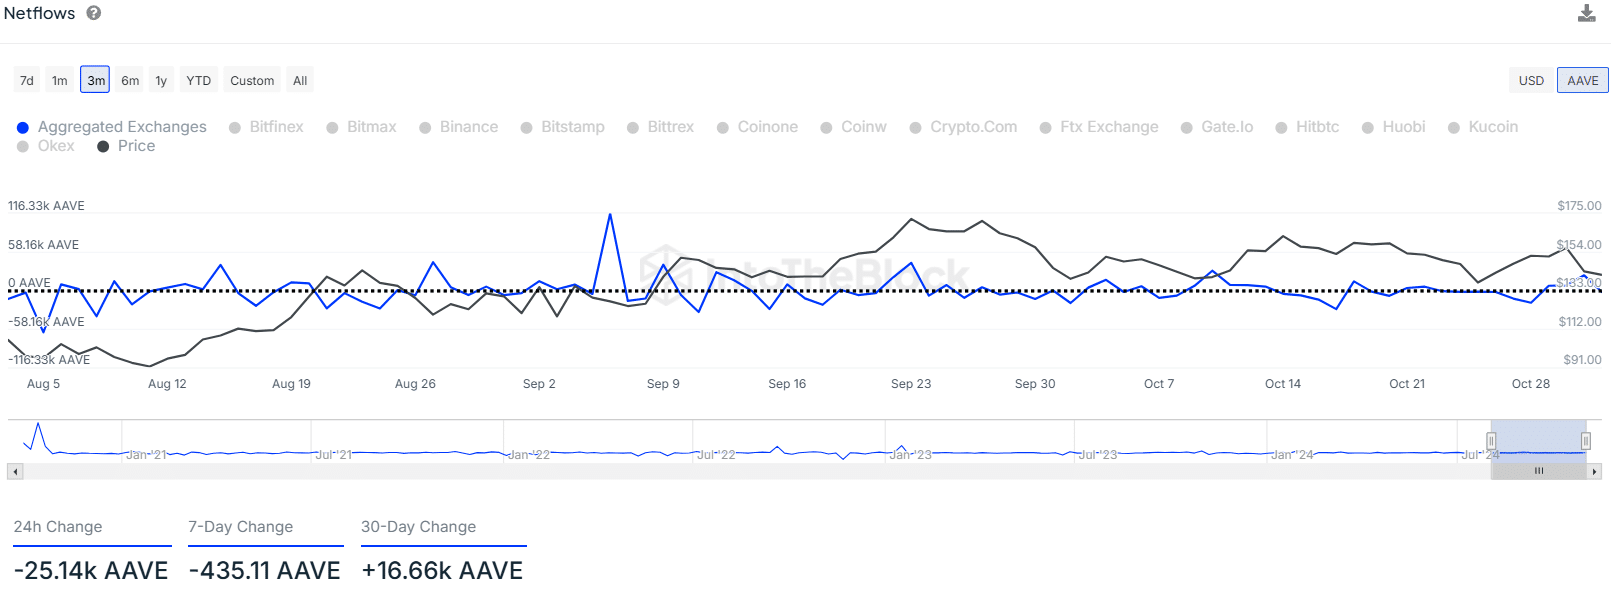
AMBCrypto found that the netflow data over the past week and month were hardly encouraging. The -435 AAVE outflows amounted to a mere $61k accumulated. The +16.66k AAVE 30-day change represented inflows of $2.3 million into exchanges.
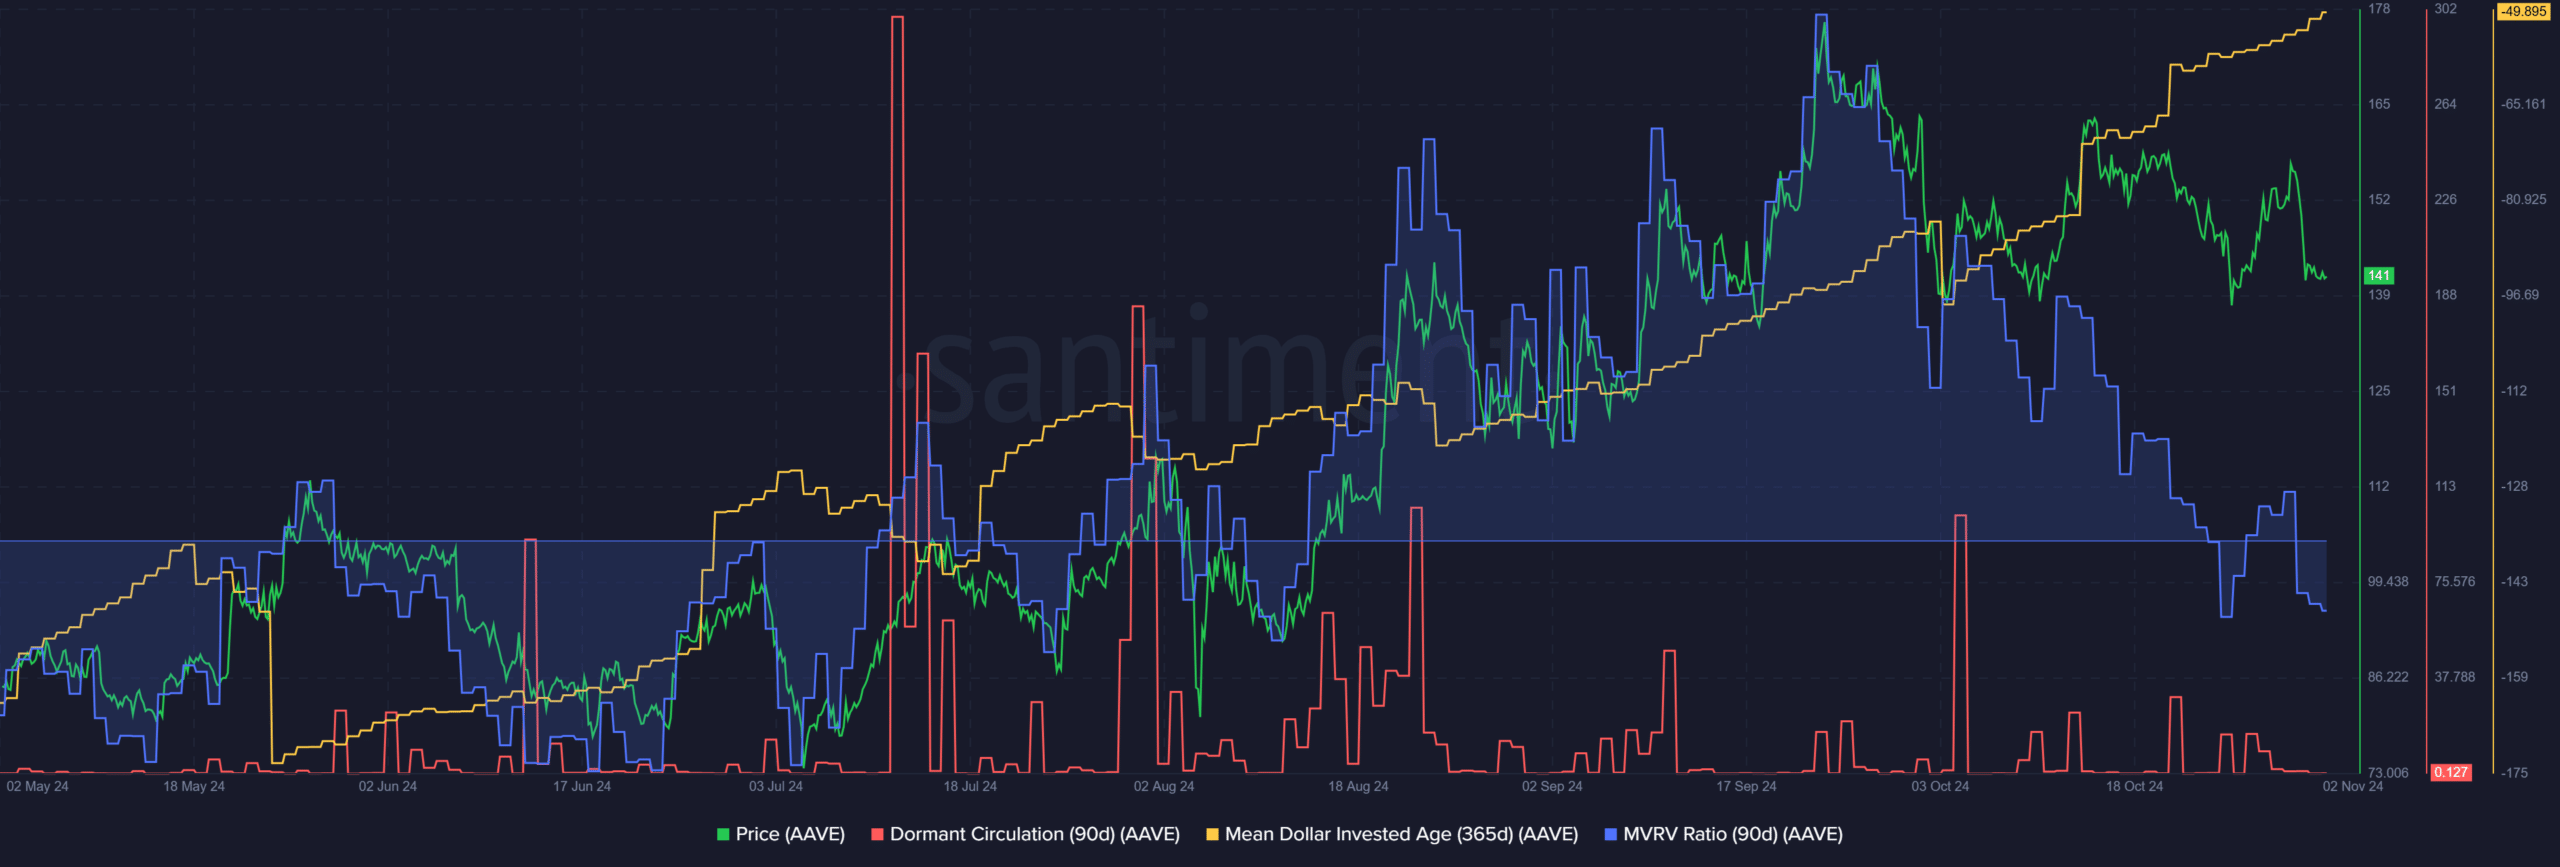
Santiment data also revealed that the dormant circulation was quiet over the past month. This highlighted subdued token movement between addresses, compared to the wave of selling in mid-July.
Hence, there likely isn’t a threat of high selling pressure in the next few days.
The falling MVRV ratio showed that 3-month holders were at a loss on average. This could incentivize slight selling pressure during a bounce towards $160. It also seemed to be an indication that profit-taking activity won’t stall bullish efforts.
These bullish efforts have already begun, but they might be more clearly visible on the weekly timeframe. For instance – The unbroken uptrend of the mean dollar invested age (MDIA) signified stagnation. Its descent would signal greater movement and new buyers and in turn, this could herald a sustainable uptrend.
AAVE gives strong clues on the higher timeframes
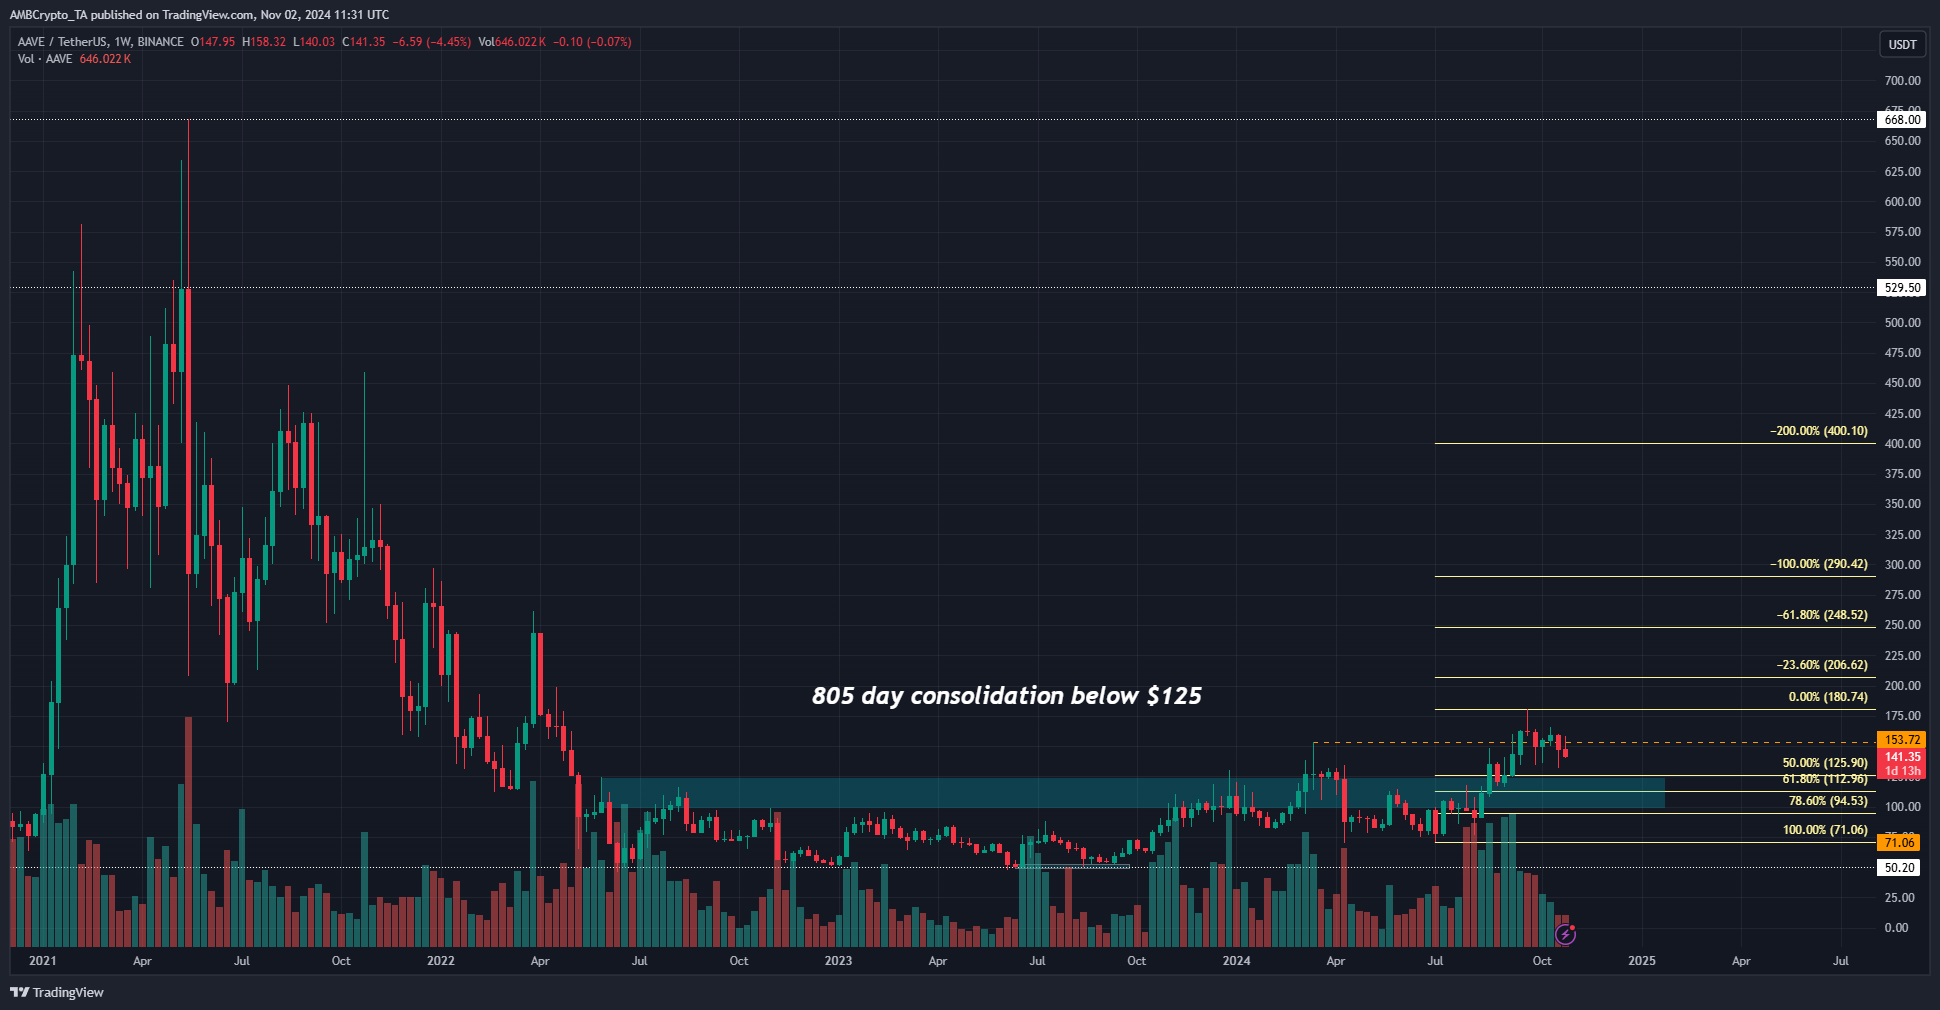
The weekly chart underlined a downtrend in the second half of 2021, one that continued throughout 2022. The $100-$120 area formed a resistance zone that wasn’t convincingly broken for 805 days.
Read Aave’s [AAVE] Price Prediction 2024-25
This long-term consolidation was broken in mid-September when the previous high at $153 was broken with a weekly session close above. Since then, AAVE has faced rejection at $180 and played defense at the $140 area.
The weekly market structure break six weeks ago was a sign of bullish intent. In the coming months, the $290, $400, and even the all-time high of $661 would be viable bullish targets. A slump in the MDIA would likely be an early sign that the altcoin is ready for a strong run upwards.