ADA buyers defend this support; here’s why an uptrend still seems unlikely

Disclaimer: The information presented does not constitute financial, investment, trading, or other types of advice and is solely the writer’s opinion.
- Cardano was trading within a higher timeframe support zone at $0.24
- While ADA is expected to climb higher, the short-term outlook is not robustly bullish yet
Cardano [ADA] saw a bounce in prices from the $0.238 level but it did not have a bullish outlook on the one-day or the four-hour chart. The recent bounce could be exhausted as the price reached a local resistance, but some buying pressure persisted.
Read Cardano’s [ADA] Price Prediction 2023-24
The weekly development report from Input Output Global showed the team continued to work to enhance the network, which is something long-term holders will take heart from. But this will likely have little bearing on prices in the near term.
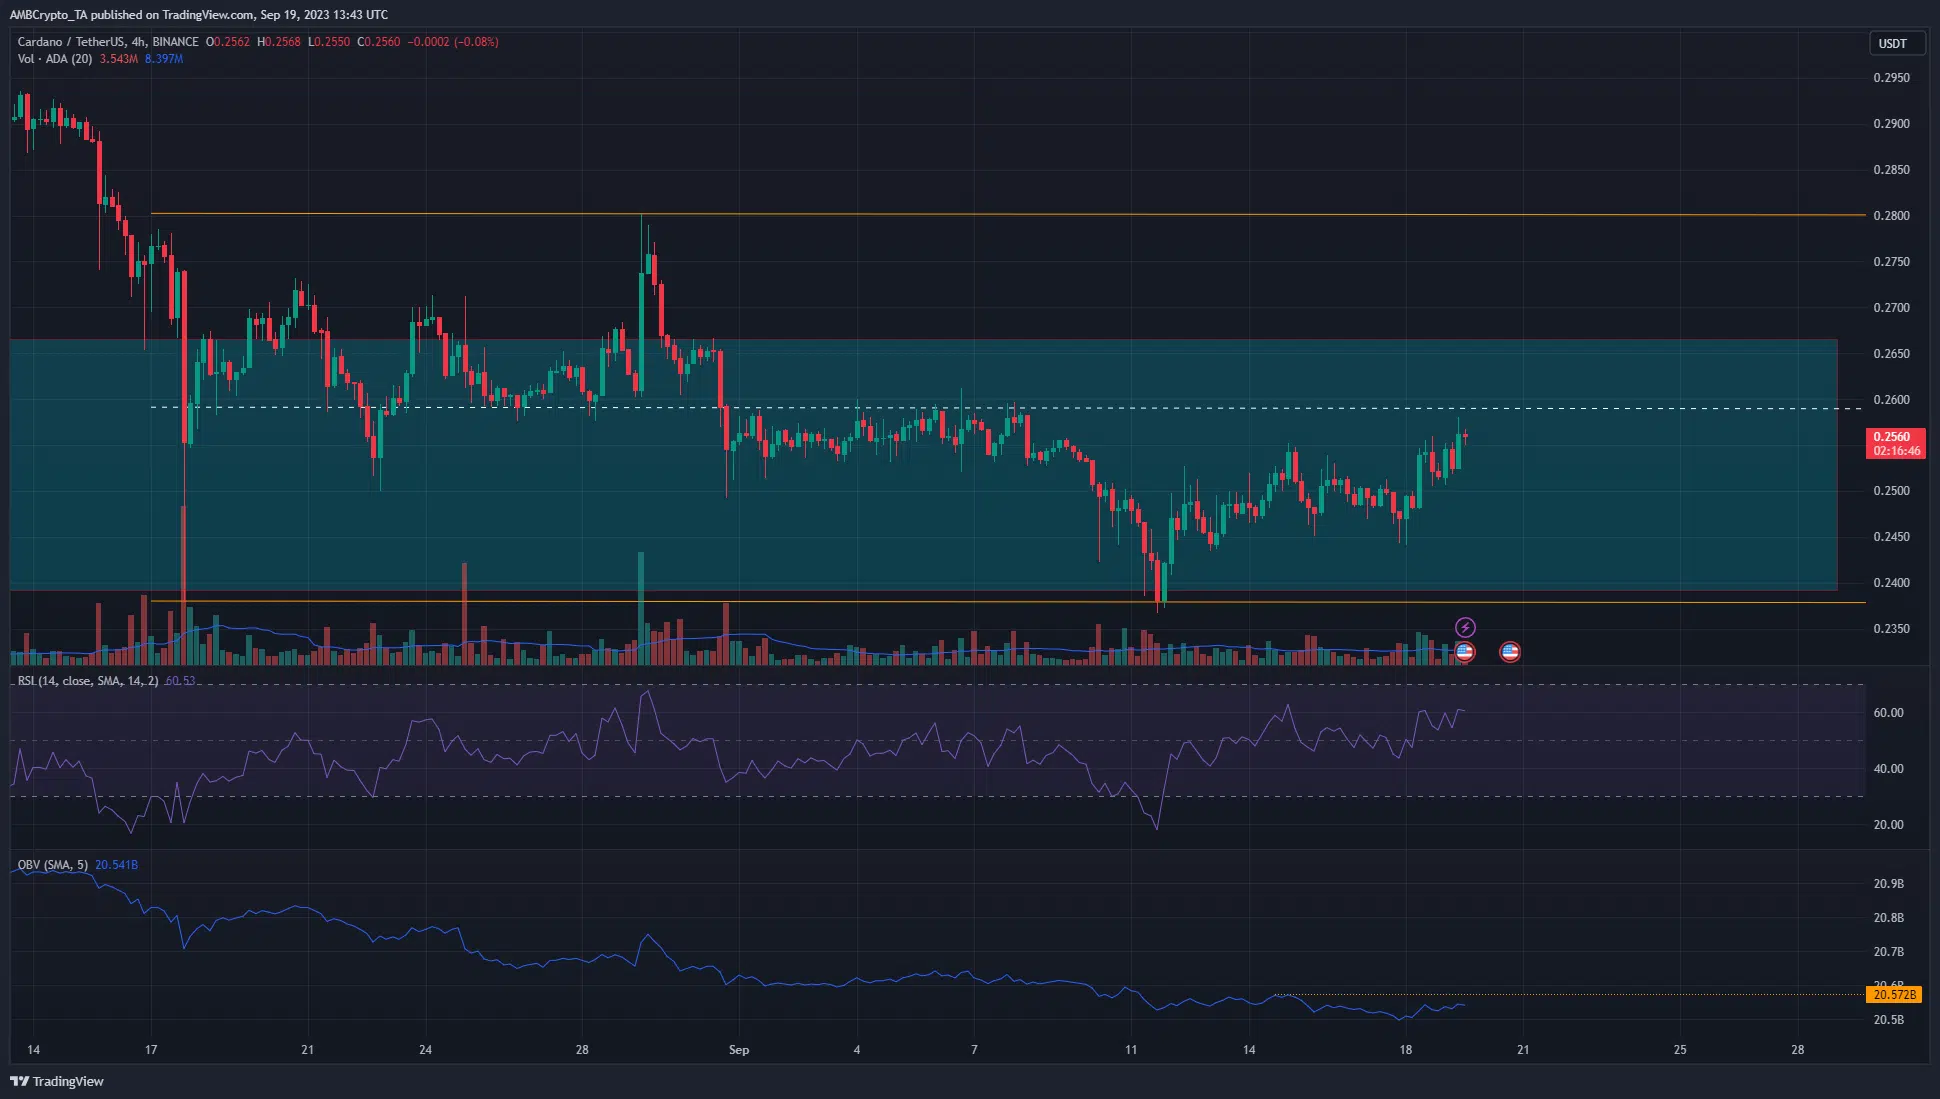
Cardano trades within a month-long range
From 17 August to 29 August, ADA registered a bounce that reached from $0.238 to $0.28. Highlighted in orange these levels marked the extremes of a range that ADA has traded within for close to a month. The mid-point of this range sat at $0.259, a level that served as support in late August but was flipped to resistance in early September.
At press time ADA was close to the mid-range resistance once more. While the Relative Strength Index (RSI) showed strong bullish momentum in recent days, the On-Balance-Volume (OBV) did not reflect firm buying pressure. The local resistance (dotted orange) on the OBV must be breached before the indicator would signal bullish intent.
The market structure on the four-hour chart was bullish, but the $0.259-$0.26 region represented a short-term bearish stronghold. ADA bulls were likely to face rejection after a move into this zone.
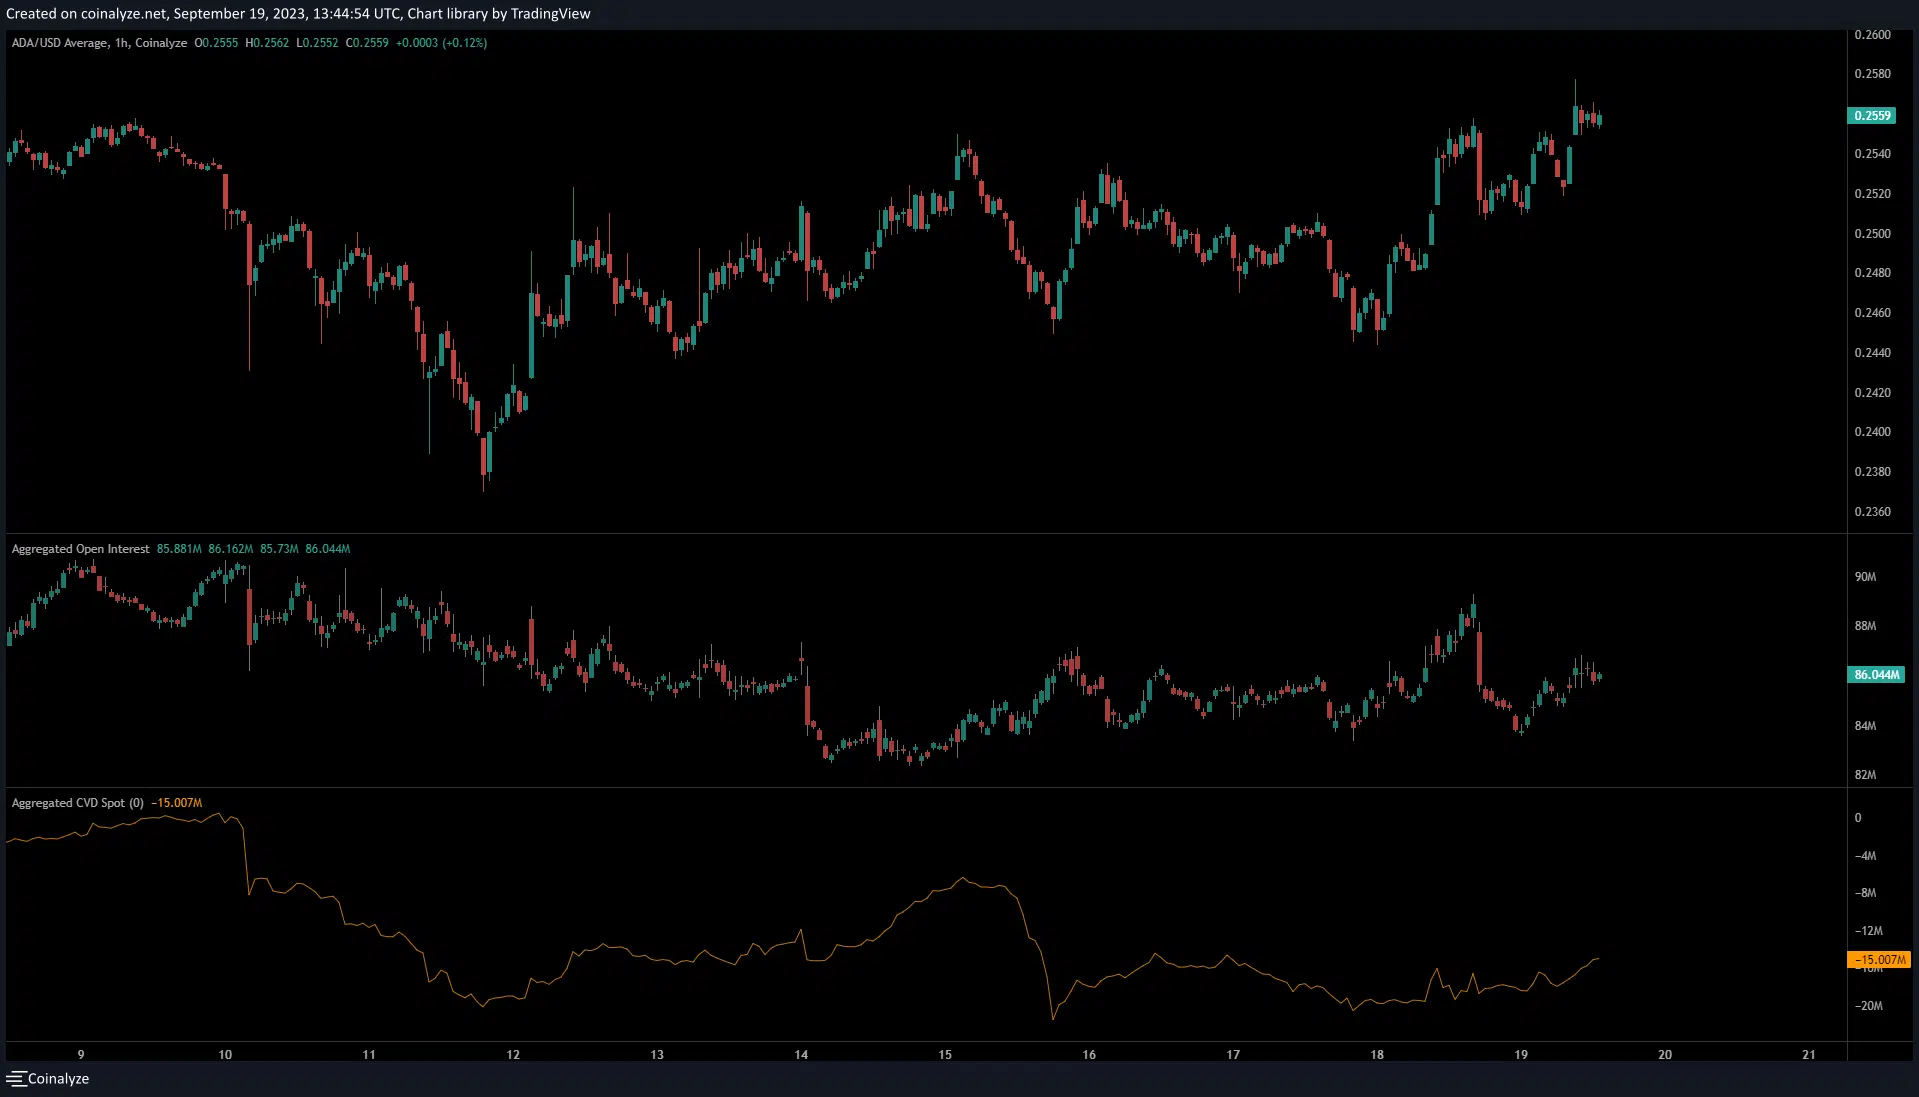
The speculators show a tendency to book their profits early after the bounce

Source: Coinalyze
On 18 September, Cardano climbed from $0.245 to $0.255, a 4.3% hike. The Open Interest also advanced northward steadily. When the bulls ran into some trouble at $0.255 and the price dipped to $0.251, the Open Interest plunged lower.
Here’s ADA’s market cap in BTC’s terms
This signaled large profit-taking activity from market participants and their belief that ADA might not breach the local resistance above $0.255. Conversely, the spot CVD has inched higher over the past 24 hours to indicate demand in the Cardano spot market.


