Aergo crypto’s latest retest leaves a short-term price target of…
Since lower cap tokens have a tendency to fully retrace quick rallies, holders and traders can seek to play it safe and exit the market with profits.

- Aergo rallied by 60% despite a bearish divergence, showing the rally’s strength
- Traders and investors should not be FOMOing right now over AERGO
Aergo [AERGO] has rallied by 181% since the low at $0.0475 on Saturday. In fact, CoinMarketCap data highlighted the token’s size relative to the larger assets. At press time, it had only 7,300 holders and a market cap of $64.44 million. Quick rallies in smaller tokens should be treated with caution, as the usual low trading volume can make it easier to drive prices higher before whales dump their holdings.
Moreover, the price has reached the key resistances from March and April 2024. The $0.17 and $0.195 levels marked the tops Aergo token formed in the past year. And, they could mark this rally’s top as well.
Aergo bulls should look to take profits, instead of bidding more
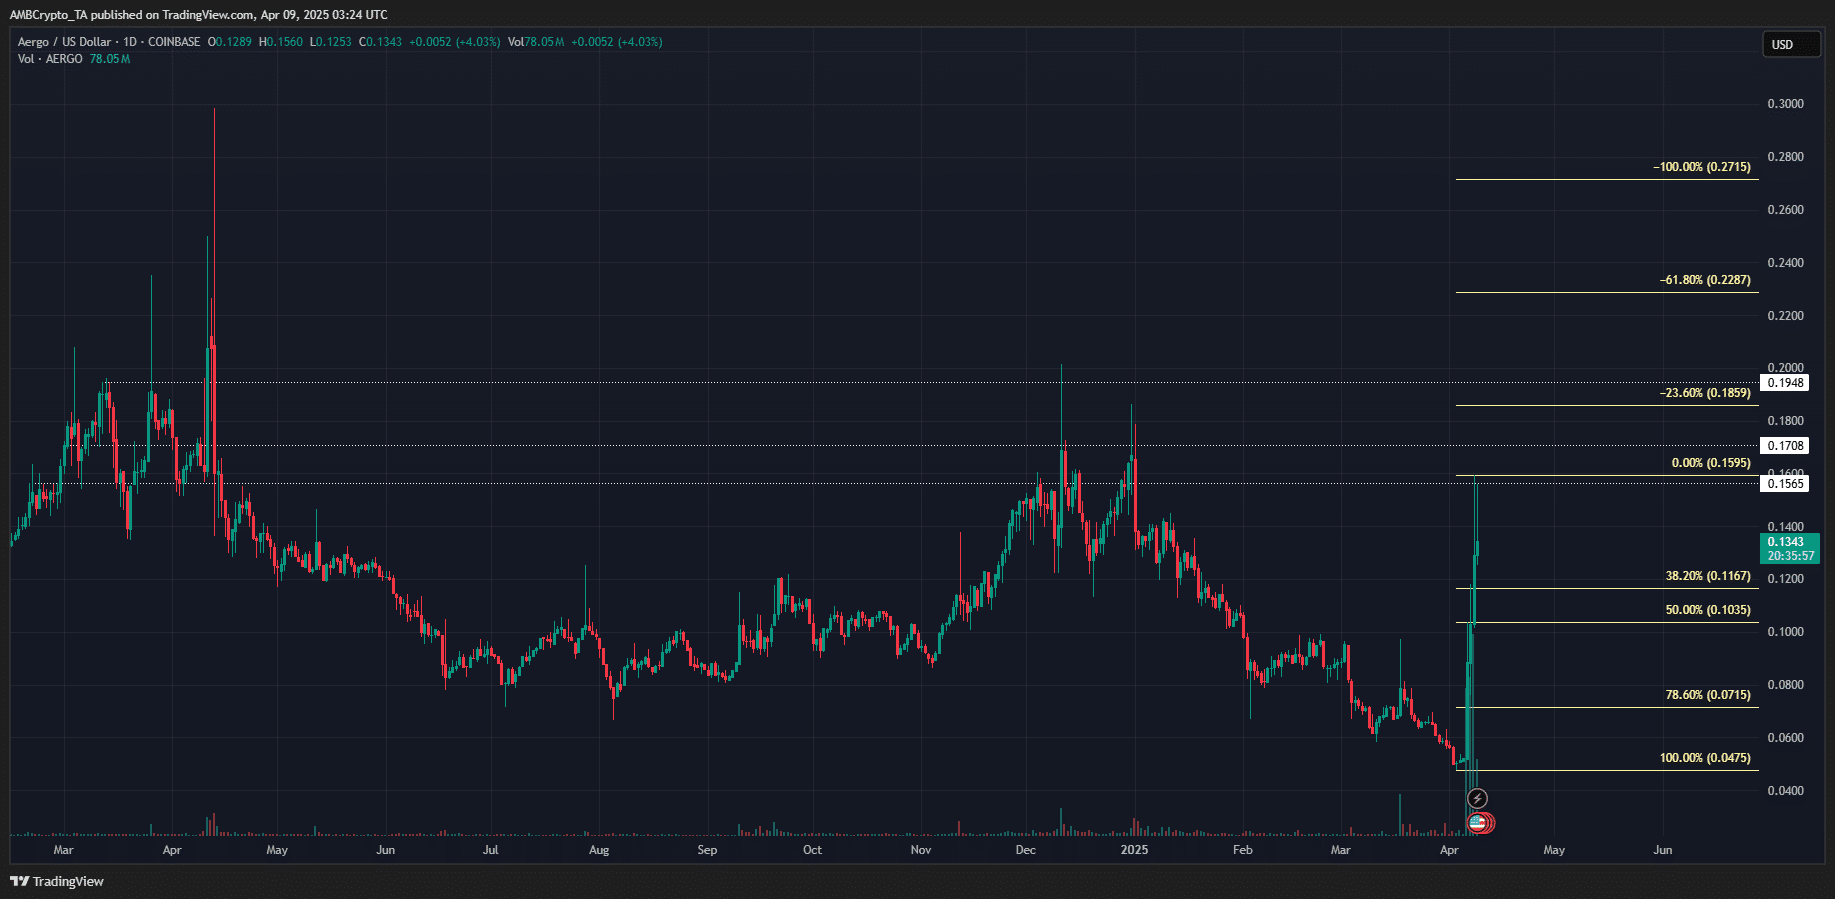
The 1-day chart revealed a bullish surge for the token, one that propelled it past the series of lower highs made since February. The session close above $0.08 on Sunday, 06 April, flipped the AERGO market structure bullishly on the 1-day chart.
The trading volume bars at the bottom have also seen enormous hikes since the weekend, underlining incredible trading volume. On Saturday, Coinbase saws 1.25 million AERGO tokens traded. This figure catapulted to 150.25 million on Sunday.
If AERGO can climb above $0.2, it would be a strong sign of sustained buying pressure. Until then, buyers should beware a bearish reversal as the price retests key supply zones.
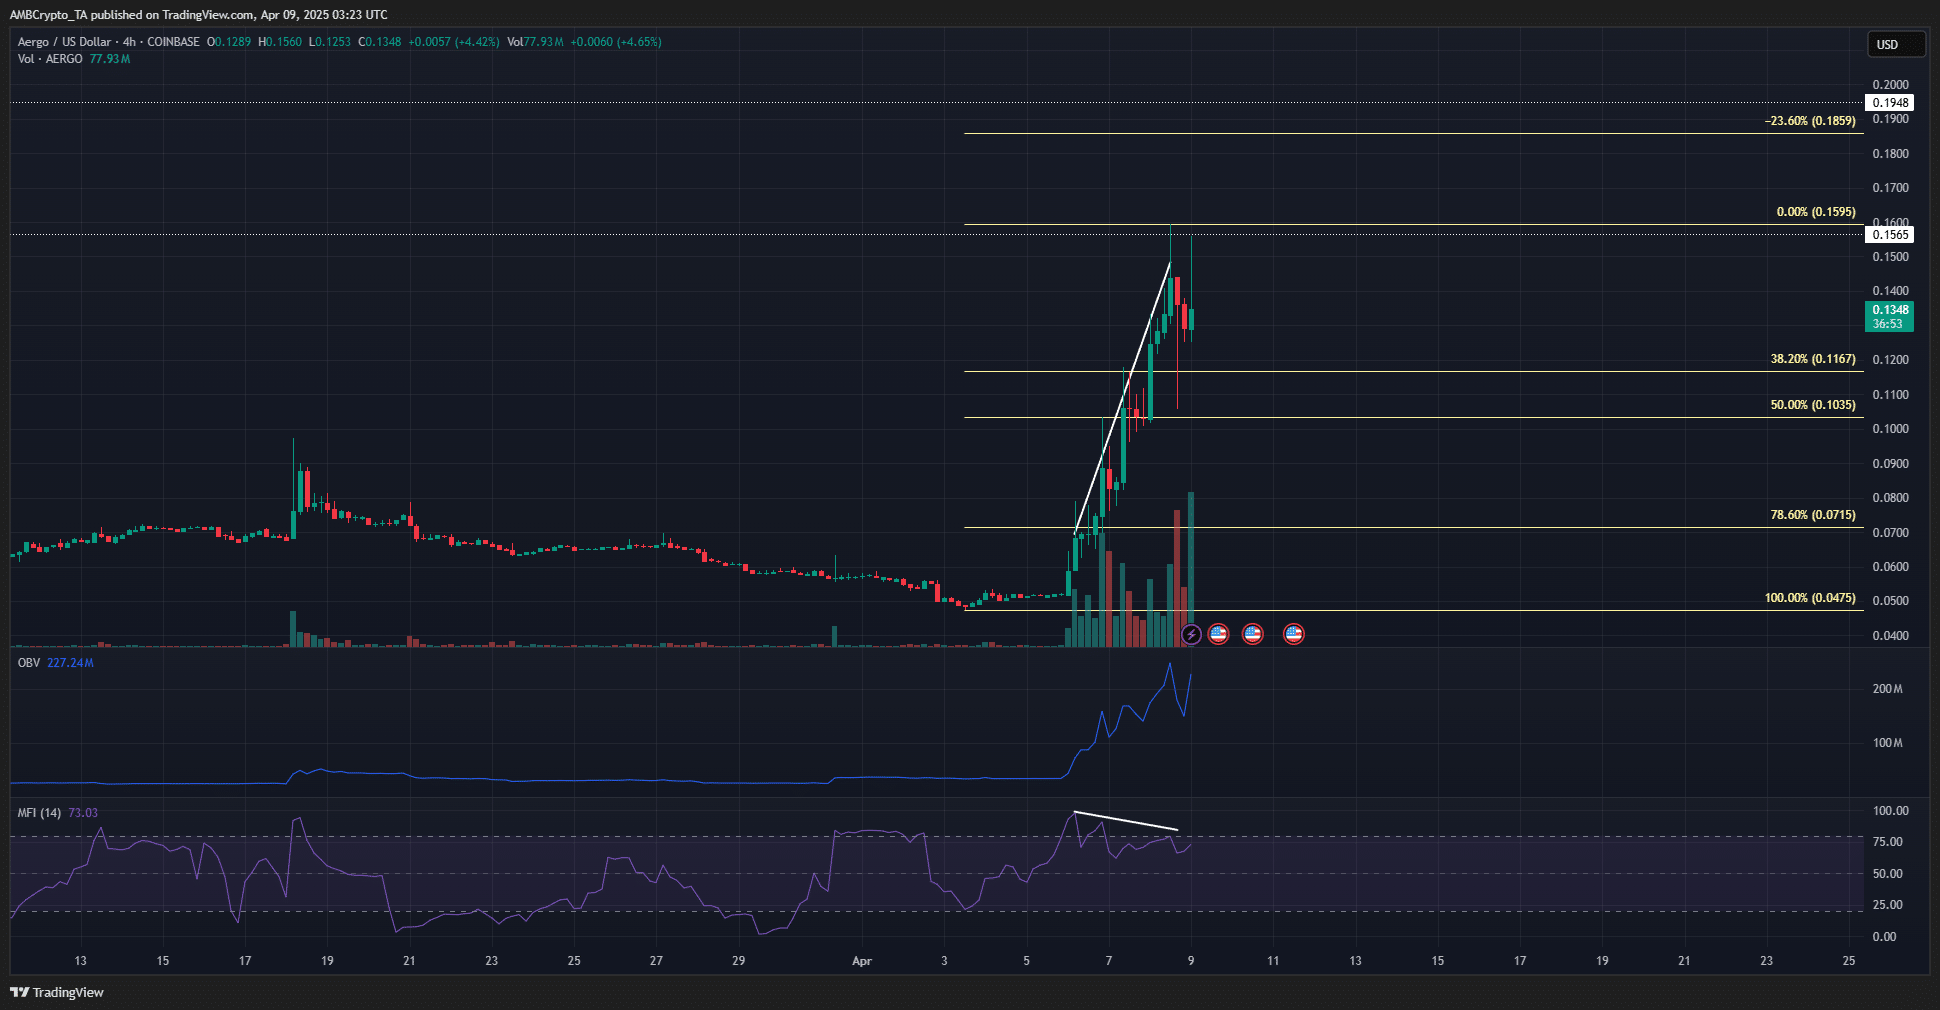
On the 4-hour chart, a strong bearish divergence between the price and the MFI was highlighted.
Even after the divergence formed, Aergo pumped by 60%, showing how difficult it can be to predict reversals for coins with such intense volume.

The liquidation heatmap of the past week revealed that AERGO allowed liquidity to build up overhead while consolidating for a few hours. This, before bursting higher beyond these pockets. This pattern appeared to end below the $0.166 liquidity pocket.
It is likely that the $0.166-$0.17 resistance zone would be retested soon. Especially since the magnetic zone seemed to be relatively close to the press time market price.
Disclaimer: The information presented does not constitute financial, investment, trading, or other types of advice and is solely the writer’s opinion