Algorand: How an old demand zone might give investors some respite

Disclaimer: The findings of this analysis are the sole opinions of the writer and should not be considered investment advice
Algorand took a turn to the downside following Bitcoin’s rejection at $39k. This was amidst turmoil in global markets as fear mounted in response to Russia’s moves in Eastern Europe. Some people argue this is a buying opportunity, a deep discount- which could be the case, but crypto has a way of diving deeper south than most people expect. As far as the near-term is concerned, Algorand flipped the $0.87 to resistance, and a Fibonacci extension level gave a location for a possible bounce in price.
ALGO- 1H
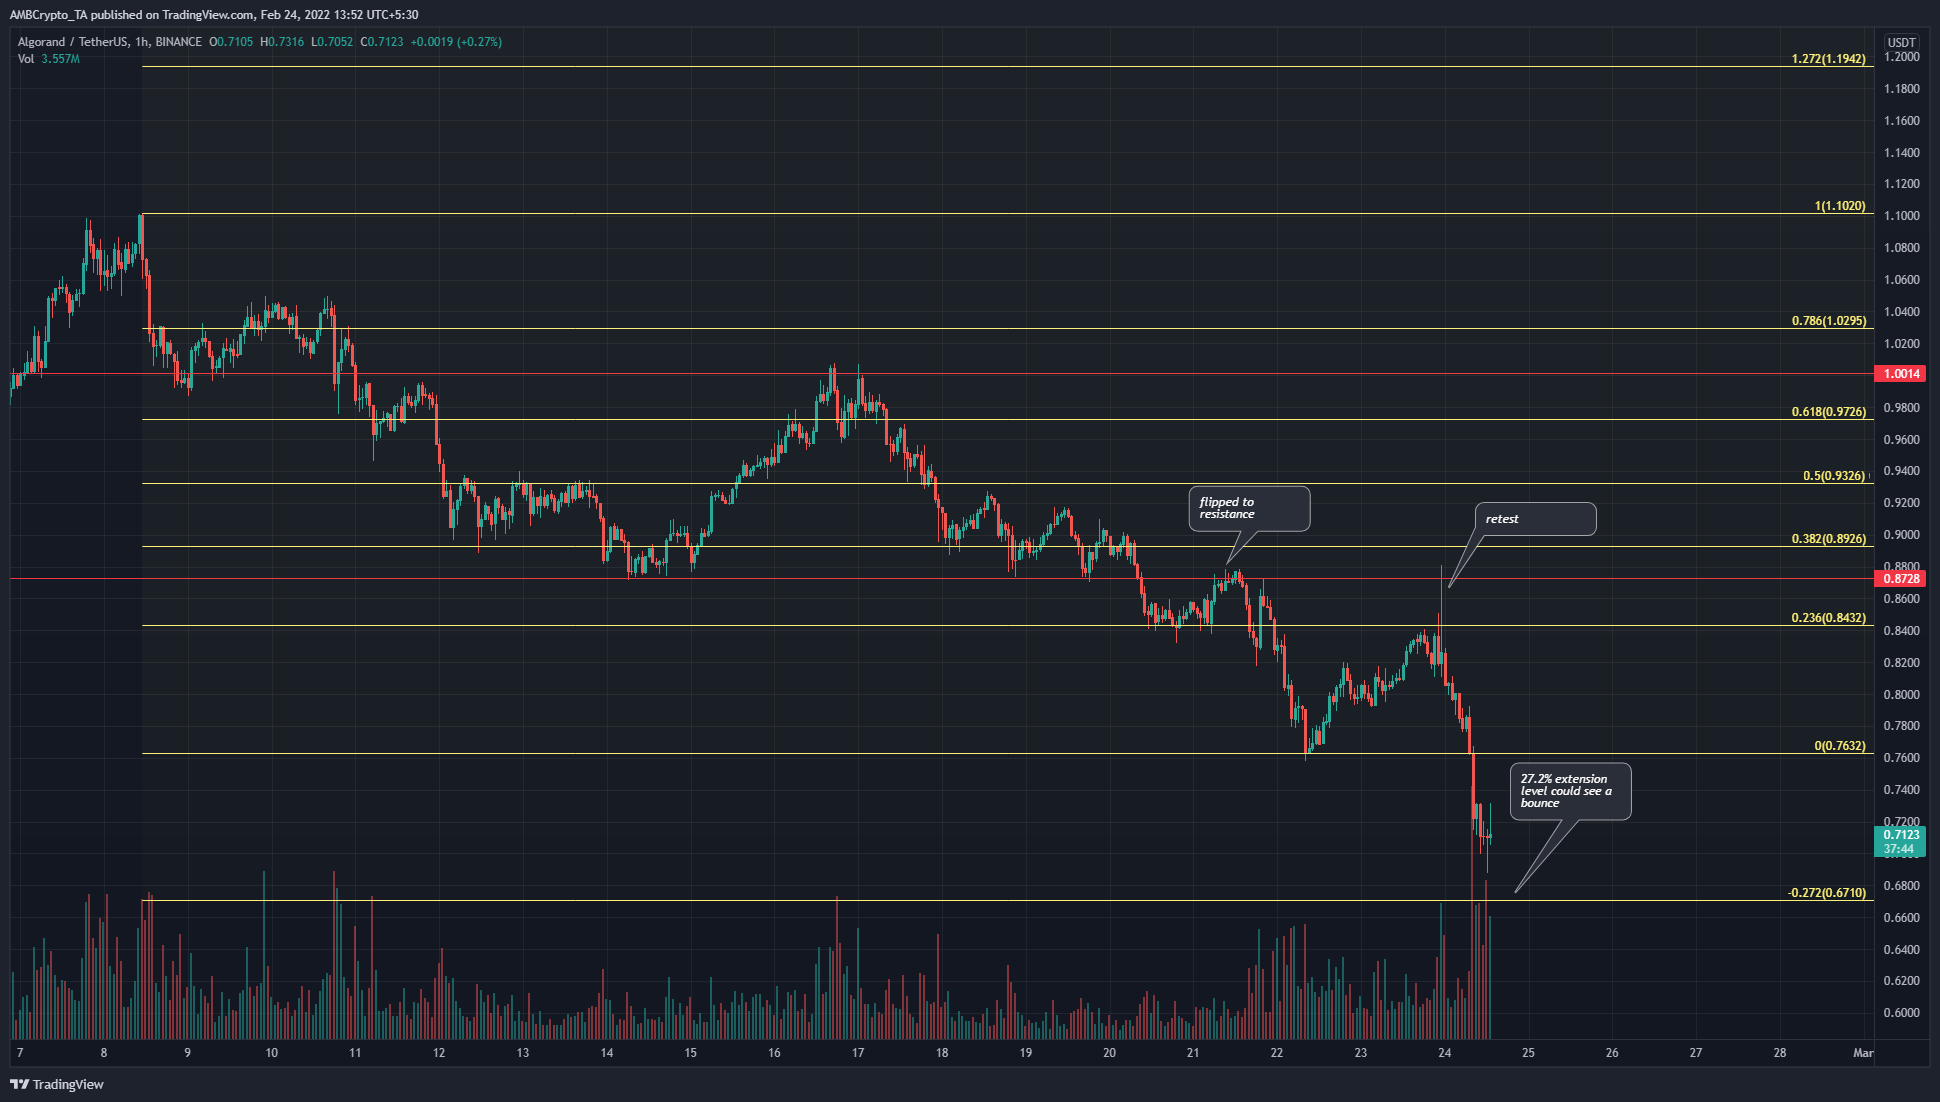
The Fibonacci retracement levels (yellow) were plotted based on ALGO’s move from $1.1 to $0.76 in the second week of February. The psychological $1 level has been a strong resistance level for much of this month, and the horizontal $0.87 was also flipped to resistance a few days ago.
Generally, the Fibonacci retracement levels have been respected to an extent- which indicated that there was the likelihood that the 27.2% extension level could also see a temporary bounce in prices for ALGO.
At the time of writing, selling volume has been significant, and dominant. The market structure was also bearish- it was a time to sell the bounce and take profit on short positions at support levels.
Rationale
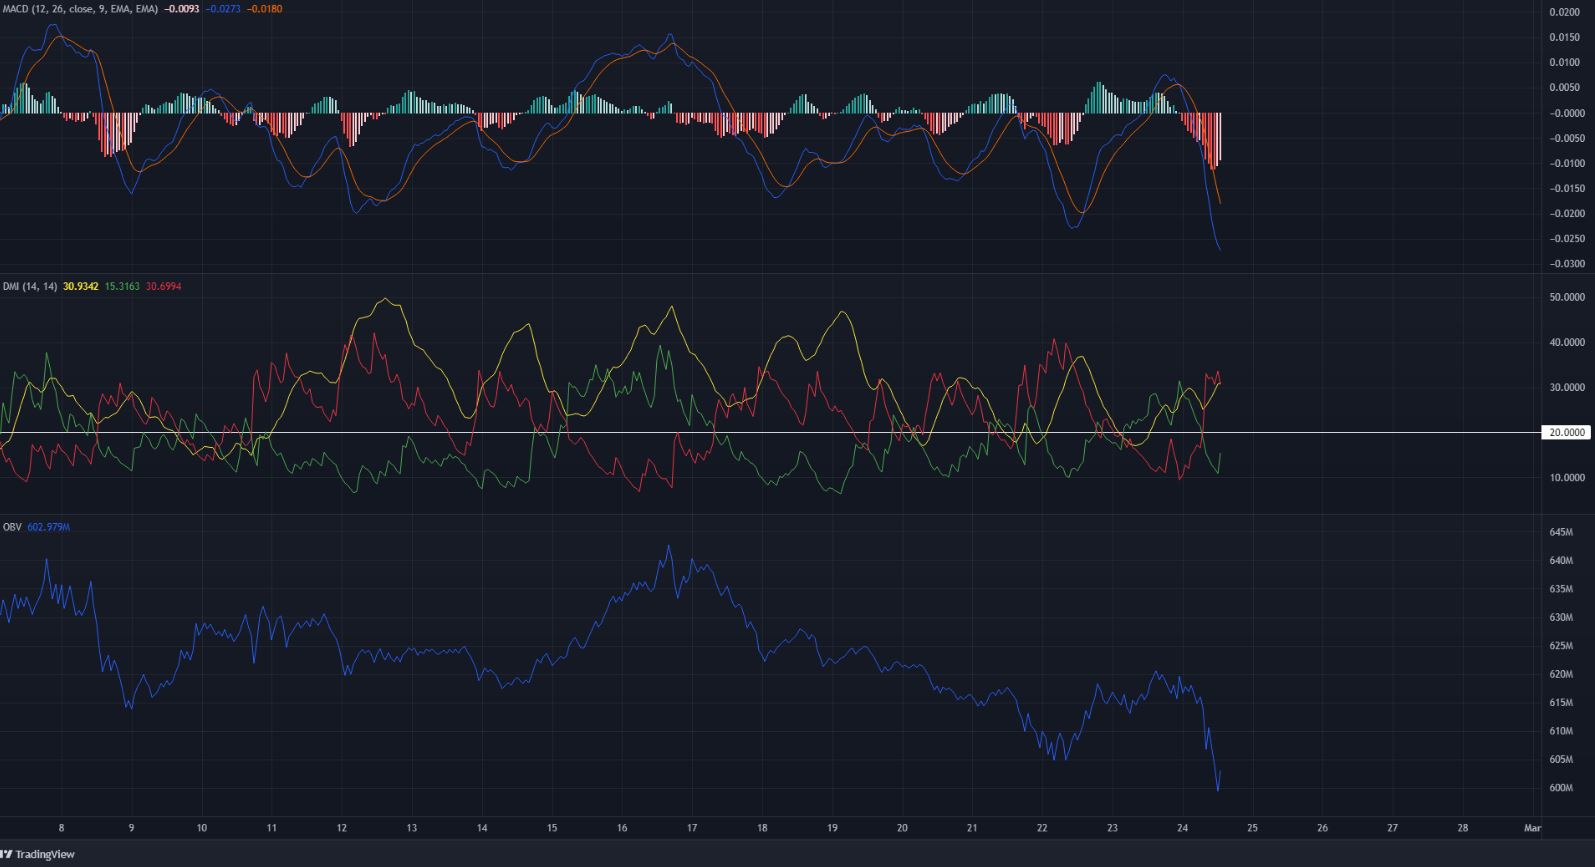
The MACD poked its nose above the zero line a couple of days ago. But immediately took a nosedive back under the zero line, in response to the surge in bearish momentum following recent market-wide fear. The Directional Movement Index showed a strong downtrend in progress, while the OBV confirmed selling volume far outweighed buying volume.
Conclusion
The market structure was bearish, and the $0.72-$0.76 area could be used to enter short positions on Algorand, targeting $0.67 for short-term trades. In the long term, Algorand was extremely bearish as well, but the $0.69 area has acted as a demand zone in May, June, and July of 2021. USDT dominance was also at 5%- a factor whose implications are important for long-term investors to be aware of.