All about TRX’s latest pullback after altcoin hits new ATH on the charts
Tron [TRX] recently hit a new ATH after a strong rally. Will it sustain momentum, or is a correction likely?

- TRON saw a record-breaking rally to find a new ATH on 4 December
- CoinMarketCap’s altcoin season index crossed well above 50 as Bitcoin strived to sustain itself above $100k
TRON [TRX] skyrocketed by over 160% over the last three weeks, peaking at $0.45 on 4 December, marking a new all-time high (ATH) on the charts. These gains aligned with the broader market’s recovery, with altcoin dominance rising significantly too.
At the time of writing, TRX was trading near $0.277, with the altcoin up by 3.85% in 24 hours.
Can TRX bulls continue their charge?
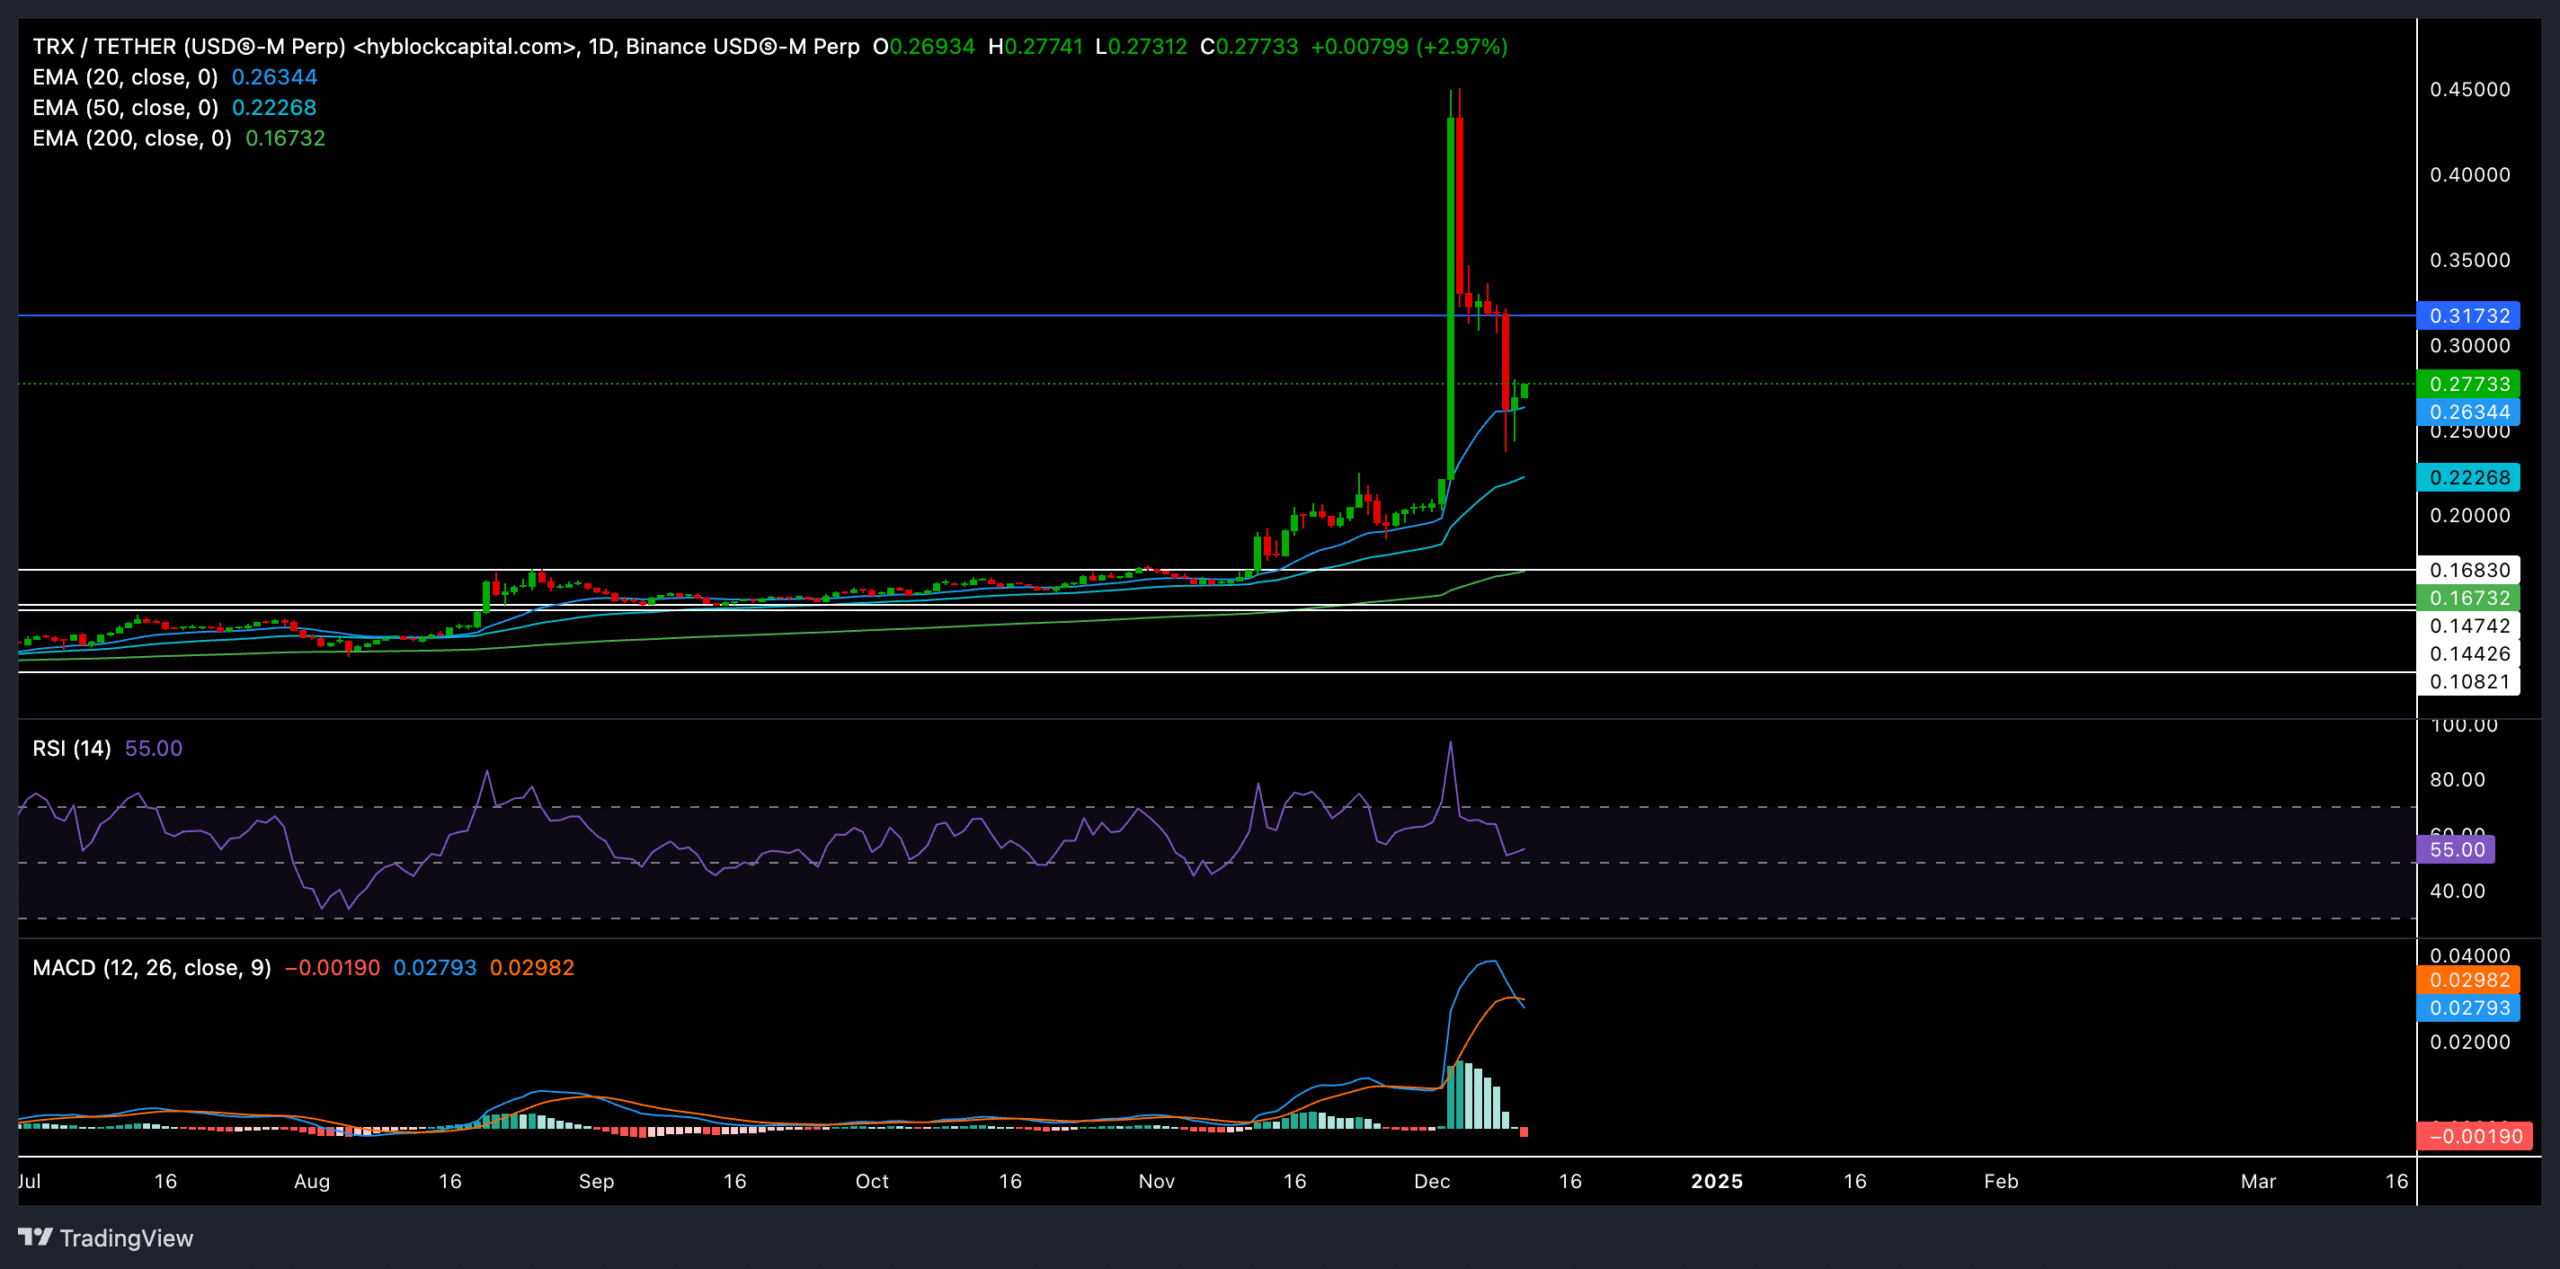
The parabolic rise in TRX’s price was supported by consistent buying pressure, with the 20-day EMA acting as dynamic support throughout the uptrend. After hitting its ATH, TRX faced a steep sell-off, declining by nearly 38% to test the $0.26 support.
While the 20-day EMA ($0.26) remains a crucial level for buyers, the recent MACD bearish crossover suggested the uptrend could slow down in the near term. Moreover, the RSI retraced from overbought levels to hover around 55, indicating reduced buying momentum.
Key levels to watch –
Immediate support: $0.26 (20-day EMA).
Critical resistance: $0.317 (horizontal level from recent high).
If buyers defend the $0.26 support, TRX could rebound towards $0.317 in the short term. A decisive break above this resistance would position TRX for a retest of the $0.35-$0.38 zone. On the flip side, a close below $0.26 could trigger a further decline towards the 50-day EMA near $0.22.
Derivatives data paints a cautious picture

TRX’s derivatives market metrics reflected mixed sentiment. Volume was down 45.73% to $847.83M, suggesting reduced trading activity following the correction.
On the other hand, Open Interest was up 3.52% to $252.71M, indicating that traders are still positioning themselves for potential moves.
The overall long/short Ratio was neutral at 0.9558, but Binance and OKX data revealed a bullish tilt, with ratios of 2.57 and 2.83, respectively.
Interestingly, TRX’s recent correction resulted in over $275k worth of short liquidations within 24 hours – A sign of potential exhaustion of bearish pressure in the short term.
While TRX’s recent rally has placed it in a strong bullish position, near-term momentum could slow down as the MACD hints at cooling momentum. Nonetheless, traders should stay cautious amid broader market movements, especially Bitcoin’s impact on altcoin sentiment.


![Aerodrome [AERO] had its moment](https://ambcrypto.com/wp-content/uploads/2026/06/Abdul-2026-06-22T084432.364-e1782114380197.webp)