
Disclaimer: The information presented does not constitute financial, investment, trading, or other types of advice and is solely the writer’s opinion.
- The sentiment and structure behind Ethereum were bullish.
- Traders can wait for a breakout over the next week and a retest before buying.
Ethereum [ETH] made enormous gains on the price charts over the past ten days and surged from $1380 as high as $1840. This measured over 30%, and the higher timeframe bias was bullish. Yet the price traded at a level of resistance from last September.
Read Ethereum’s [ETH] Price Prediction 2023-24
Ethereum’s on-chain metrics showed a large amount of ETH was likely bought during the sell-off on 10 March. The metrics did not agree on continued accumulation since then, but traders can monitor them to have an advanced warning of large movements of Ethereum.
Ethereum bulls skirmish at the $1800 resistance once again
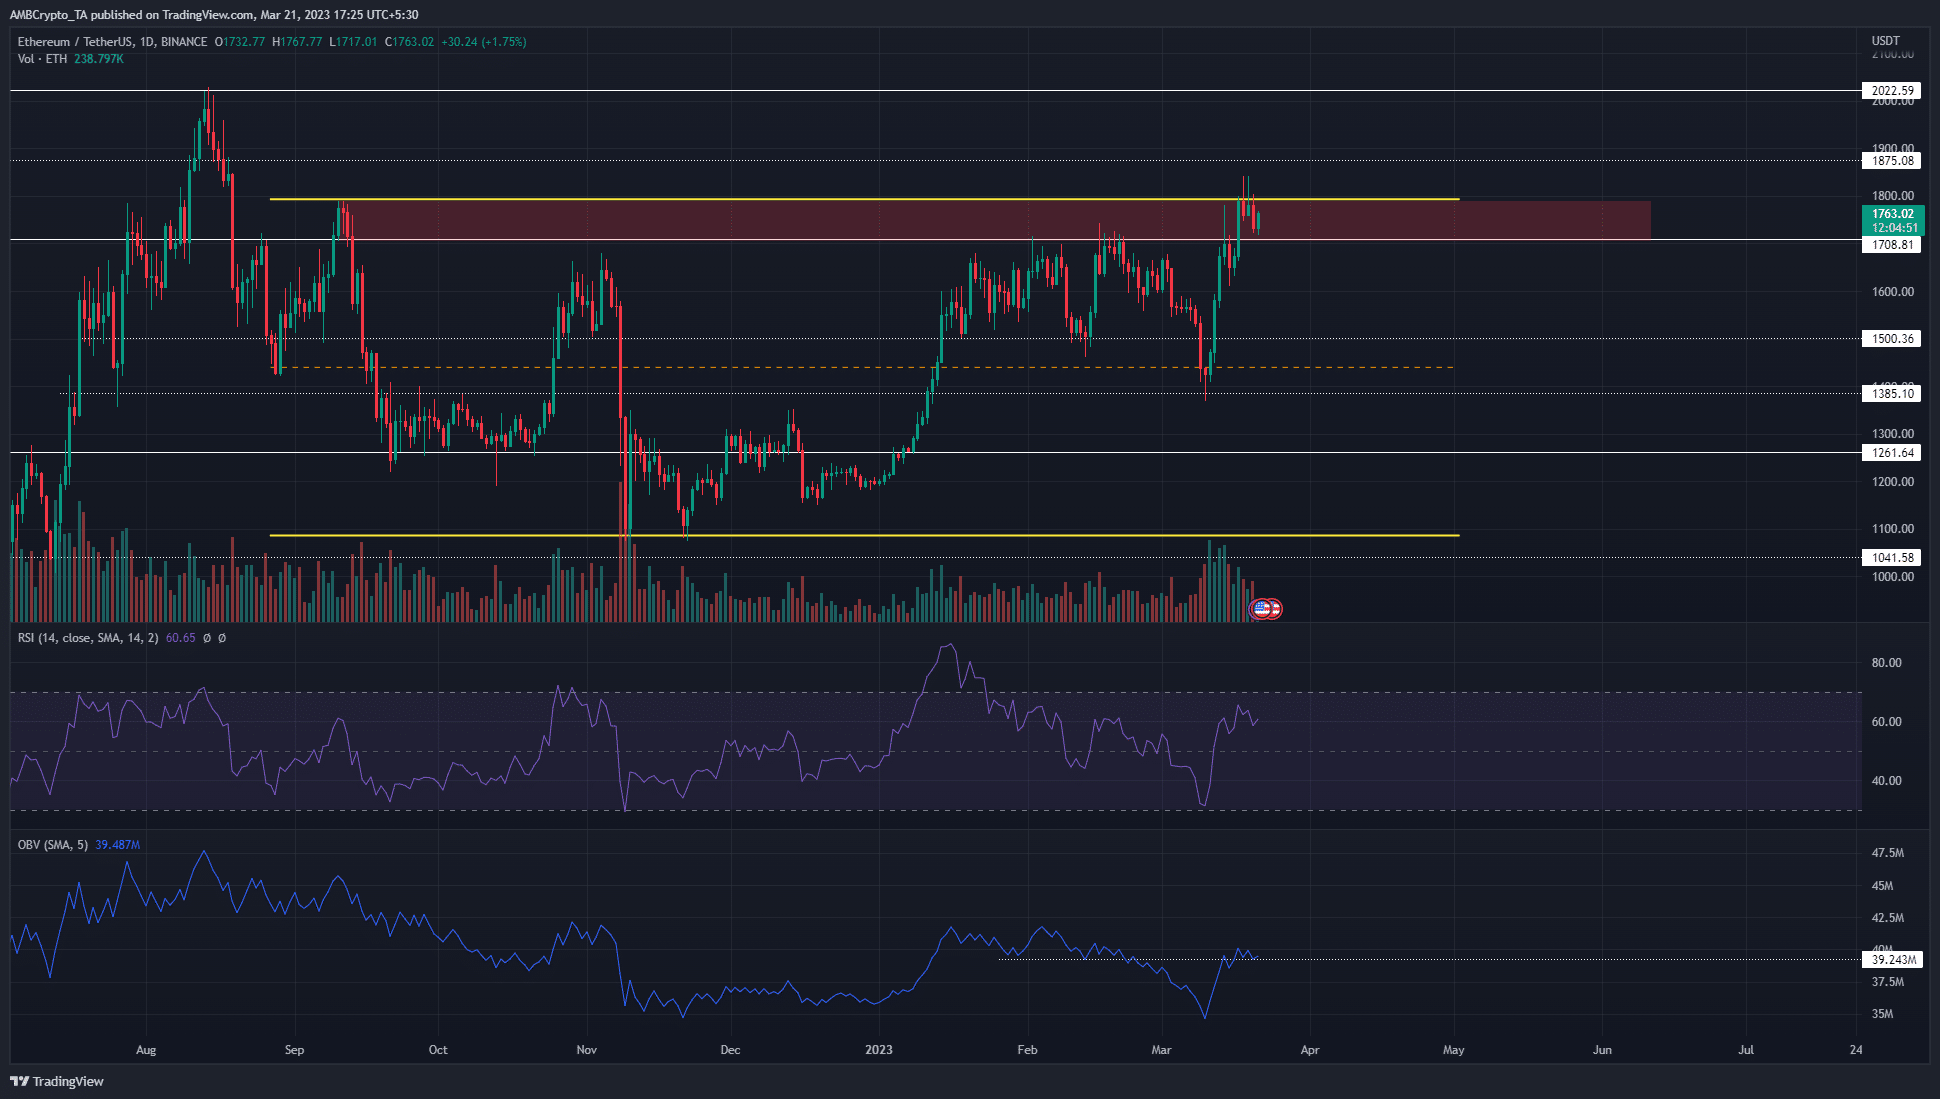
Source: ETH/USDT on TradingView
Since September, the $1710-$1790 area has marked a bearish order block on the daily timeframe. The price has not closed a one-day session above $1790, although it has seen forays above $1800 on the lower timeframes.
The indicators showed strong bullishness at the range highs. The RSI stood at 60 to indicate strong bullish momentum. The OBV also marked a sharp reversal after a drop a few days ago and has reclaimed the support from January.
However, due to the presence of resistance from the order block, buyers can wait for a move beyond this level before buying. Meanwhile, short sellers can look for a break in structure on lower timeframes and short ETH if they have sound reason to believe it will retrace its recent gains.
That would be trading against the higher timeframe trend. The daily market structure was bullish, although the selling pressure on 9 and 10 March appeared to give bears renewed hope. Since then, the bulls have breached local highs to assert their dominance. A drop below $1615 could see bullish pressure wane.
Is your portfolio green? Check out the Ethereum Profit Calculator
Exchange outflow returns to mean levels
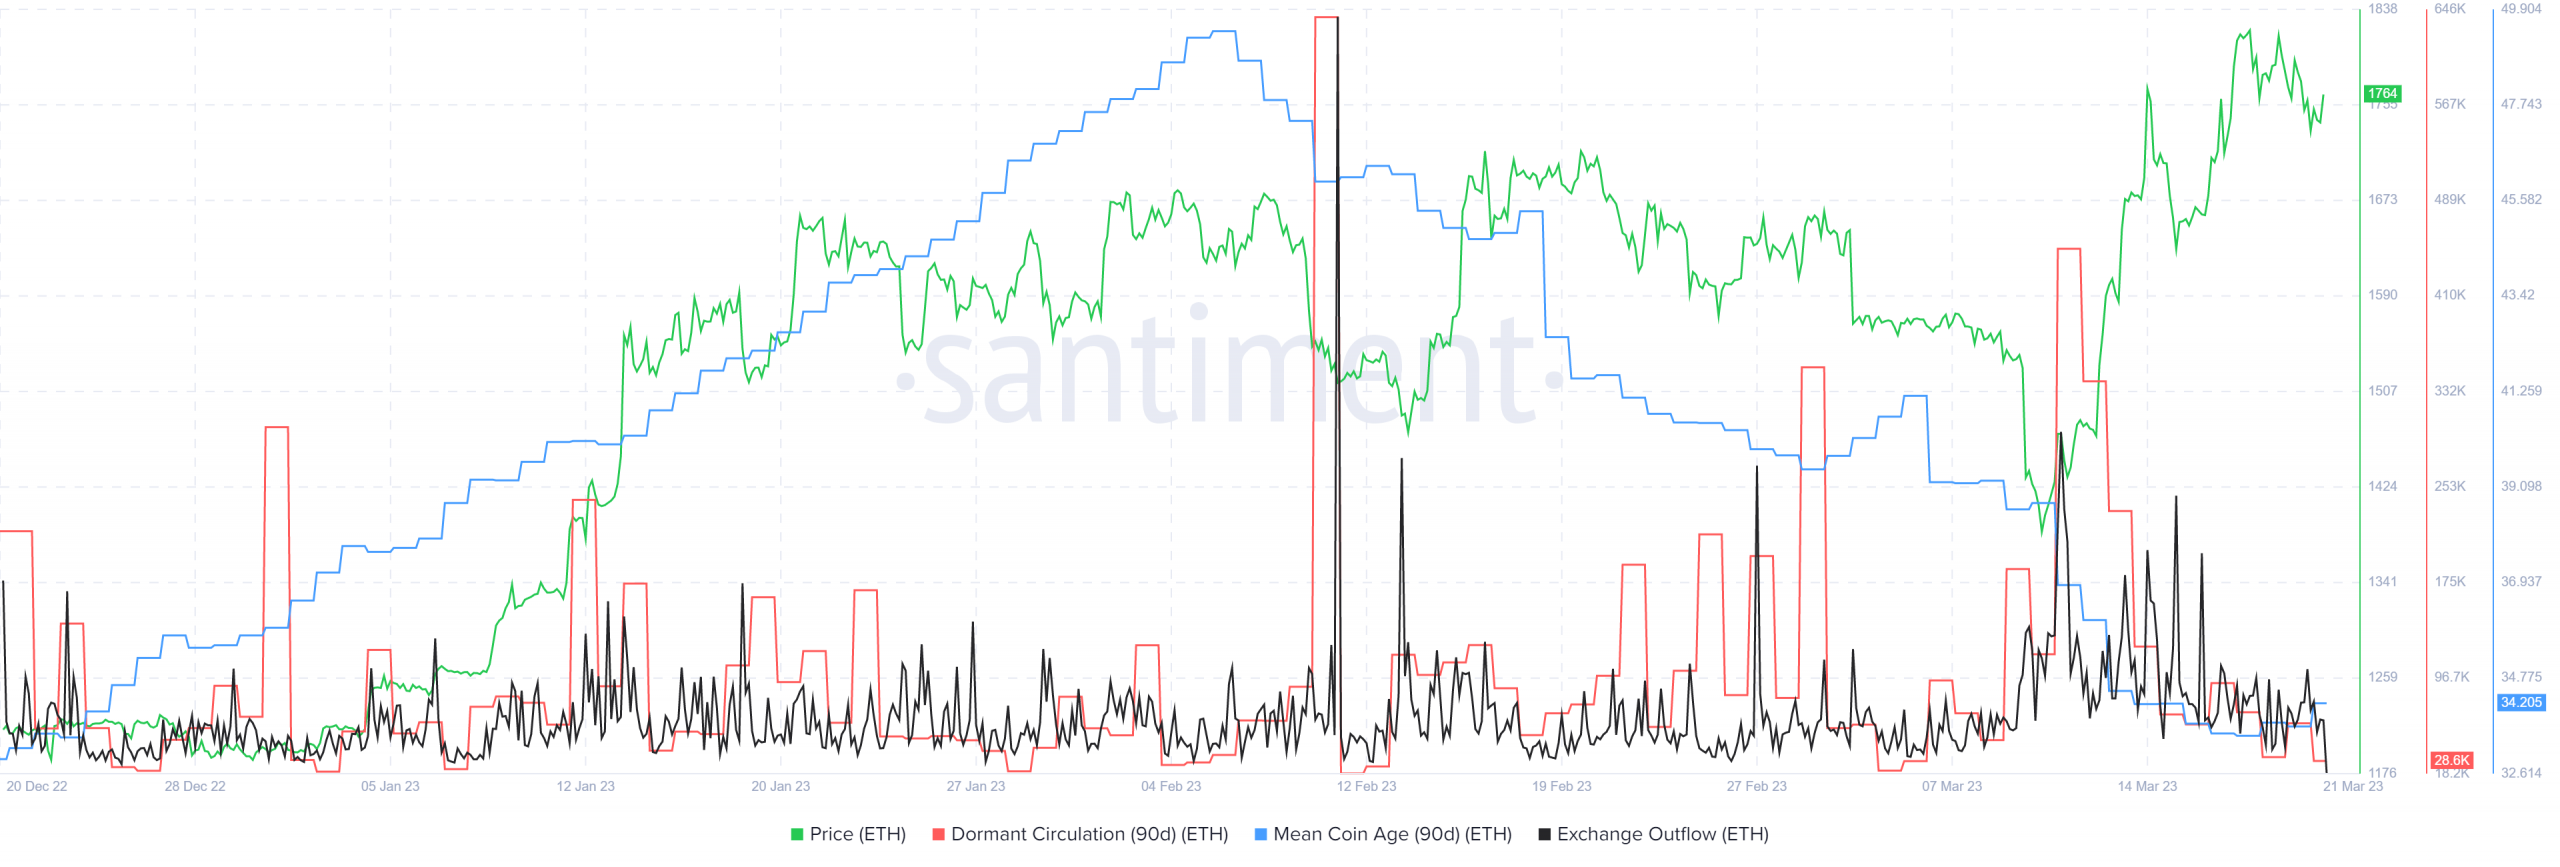
Source: Santiment
Santiment’s data showed that there was a huge spike in the flow of ETH out of exchanges on 11 and 15 March. This suggested a large volume of the asset was transferred to storage outside of exchanges, which was indicative of accumulation. This was when dormant circulation also saw a massive spike, but no similar spikes were seen in recent days.
However, the 90-day mean coin age has been falling since February. This indicated the opposite of accumulation and showed the increased movement of ETH between addresses, which generally pointed toward selling pressure.