
After witnessing a 2.2 percent rise in the past 24-hours, the crypto market cap was hovering in the $1.6 trillion range at press time. As alts seemed to consolidate, Bitcoin, on the other hand, revealed few signs of recovery.
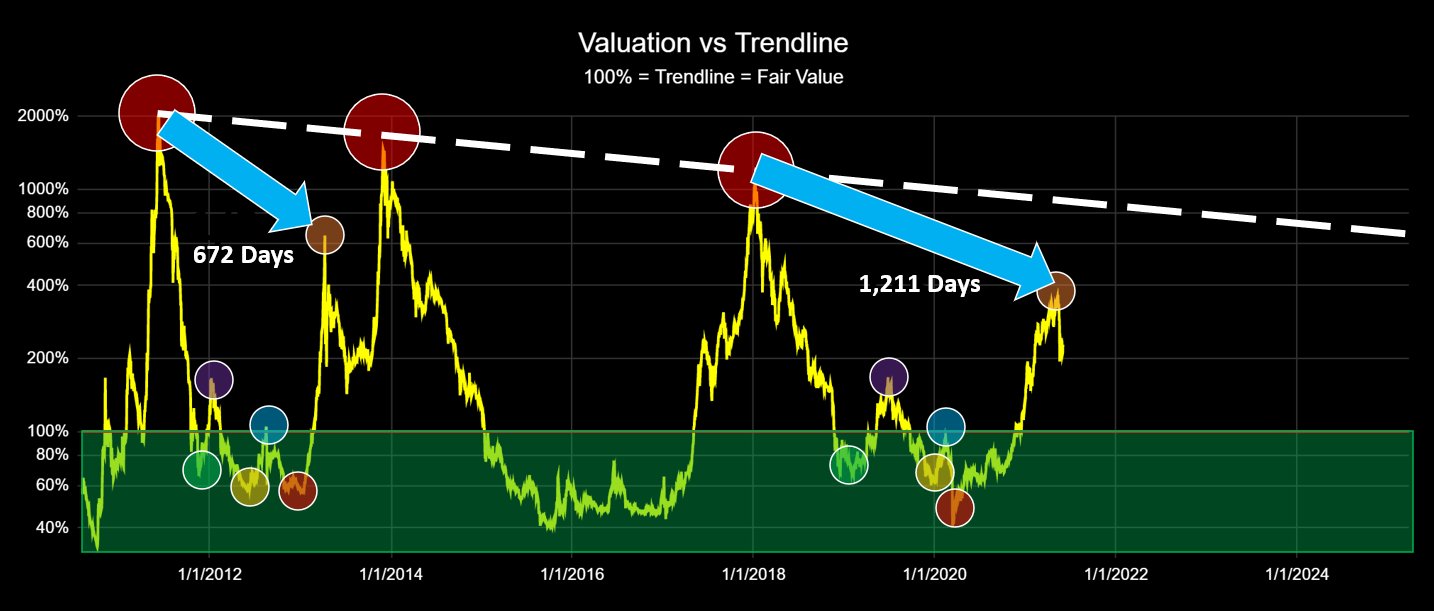
Popular analyst Benjamin Cowen recently asserted that the crypto market cap had hit an intermediate top recently. He added,
“Market cycle top may not come in 2021, likely later…”
As depicted in the chart below, the time between the first market cycle peak and the intermediate peak of the following cycle was approximately 672 days. On the other hand, the time taken by the most recent peak to get to the intermediate’s level had evidently risen by 539 days.
Talking about the possibility of a V-shaped recovery, Cowen said,
“Highly doubt V-shaped recovery. In fact, a short-term pump would make me more bearish as I imagine it would be a bull trap. We need months of consolidation, I think.”
Source: Twitter
In the month of April, Bitcoin’s price recorded a new all-time high as it shot past the $60,000 mark. After consolidating for a few days, the asset’s price started dropping. Continuing its downtrend in the latter half of May, the coin consistently traded in the $32k-$48k price bracket.
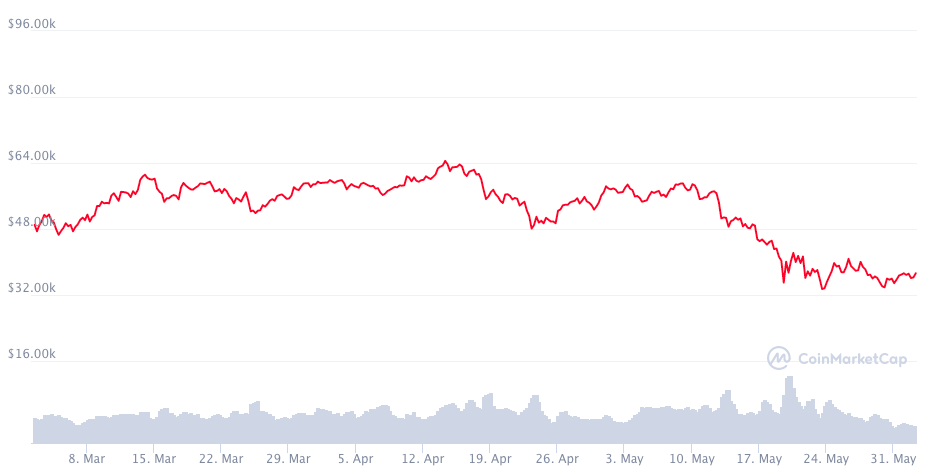
Source: CoinMarketCap
Nonetheless, Bitcoin had recorded brief upside moves recently, but no move was substantial enough to pull the coin’s price up to the $50,000 mark again. A relief rally at this point, according to Cowen, opens up the possibility of two scenarios. One, the coin could potentially set itself on the path of recording new all-time highs, or two, the rally would merely bring in some relief in the coin’s broader downward trend.
The coin’s general trend over the past several weeks has evidently been bearish. Nonetheless, as observed in the daily chart below, the MACD line had recently registered a bullish crossover with the signal line. The former only seemed to advance itself further in the upward direction, at press time. Additionally, both the lines hovering well below the 0 line, reinforced the bullish signal further.
Drawing parallels with similar prominent crossovers, Cowen said,
“In the past (March 2020) when we’ve had crosses like this, after a pretty large sell-off, the price of Bitcoin turned up for a while.”
Similarly, after 2017’s crossover, the price of Bitcoin rallied up by 33-34 percent. Even though the general trend was bearish even at that time, it did not stop Bitcoin from pulling off a substantial northward movement. A congruent move now would take Bitcoin’s price up to around $50k. Cowen added,
“If we do get a relief rally that takes us back to those levels, I don’t think we’re necessarily out of the woods… We are going to get a few days where we’ll move up rather than a consistent, persistent move to the downside.”
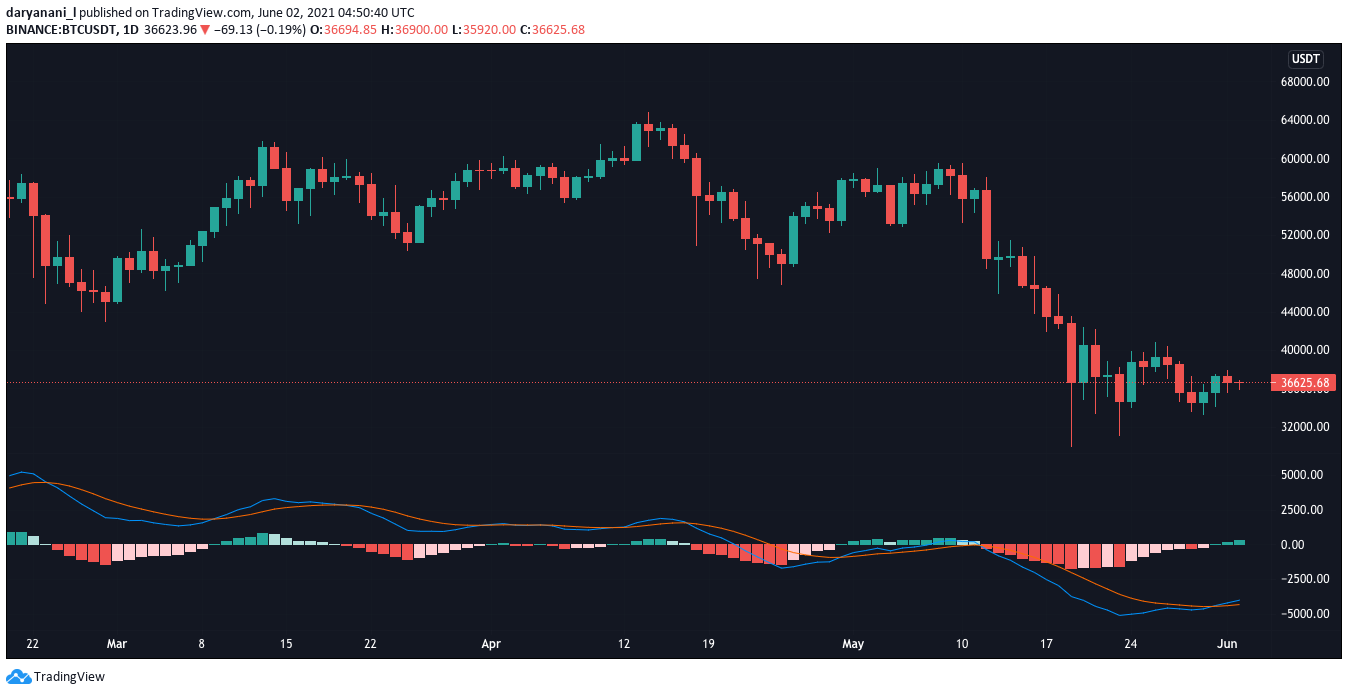
Source: BTC/USDT
Nevertheless, the weekly chart below painted a different picture. Highlighting the bearishness on the weekly time frame, Cowen implied that it could potentially act as a hindrance to Bitcoin recording new ATHs. He also warned that the “overarching” MACD trend could possibly extend itself for a few more weeks. Further asserting this to be a legitimate entry point, Cowen added,
“Bitcoin pulling back such a significant amount does offer the ability to purchase it at a significant “discount” from what it was just a few weeks ago.”


