


-Bitcoin experienced a price decline after hitting $30,000, leading to speculations about its future trend.
-Key metrics like volume, active addresses, and retail investor data suggest FOMO may have played a role in the recent surge.
At the onset of the week, Bitcoin took a tumble from the $30,000 price range, causing numerous conjectures about its future trajectory. Is the price decline an indication of an ongoing downturn, or could it be a market correction following FOMO-driven growth?
Read Bitcoin (BTC) Price Prediction 2023-24
Bitcoin FOMO uptrend?
Analyzing key metrics such as volume, active addresses, and retail investor data is crucial in determining whether the recent surge of Bitcoin (BTC) into the $30,000 price range was influenced by Fear of Missing Out (FOMO).
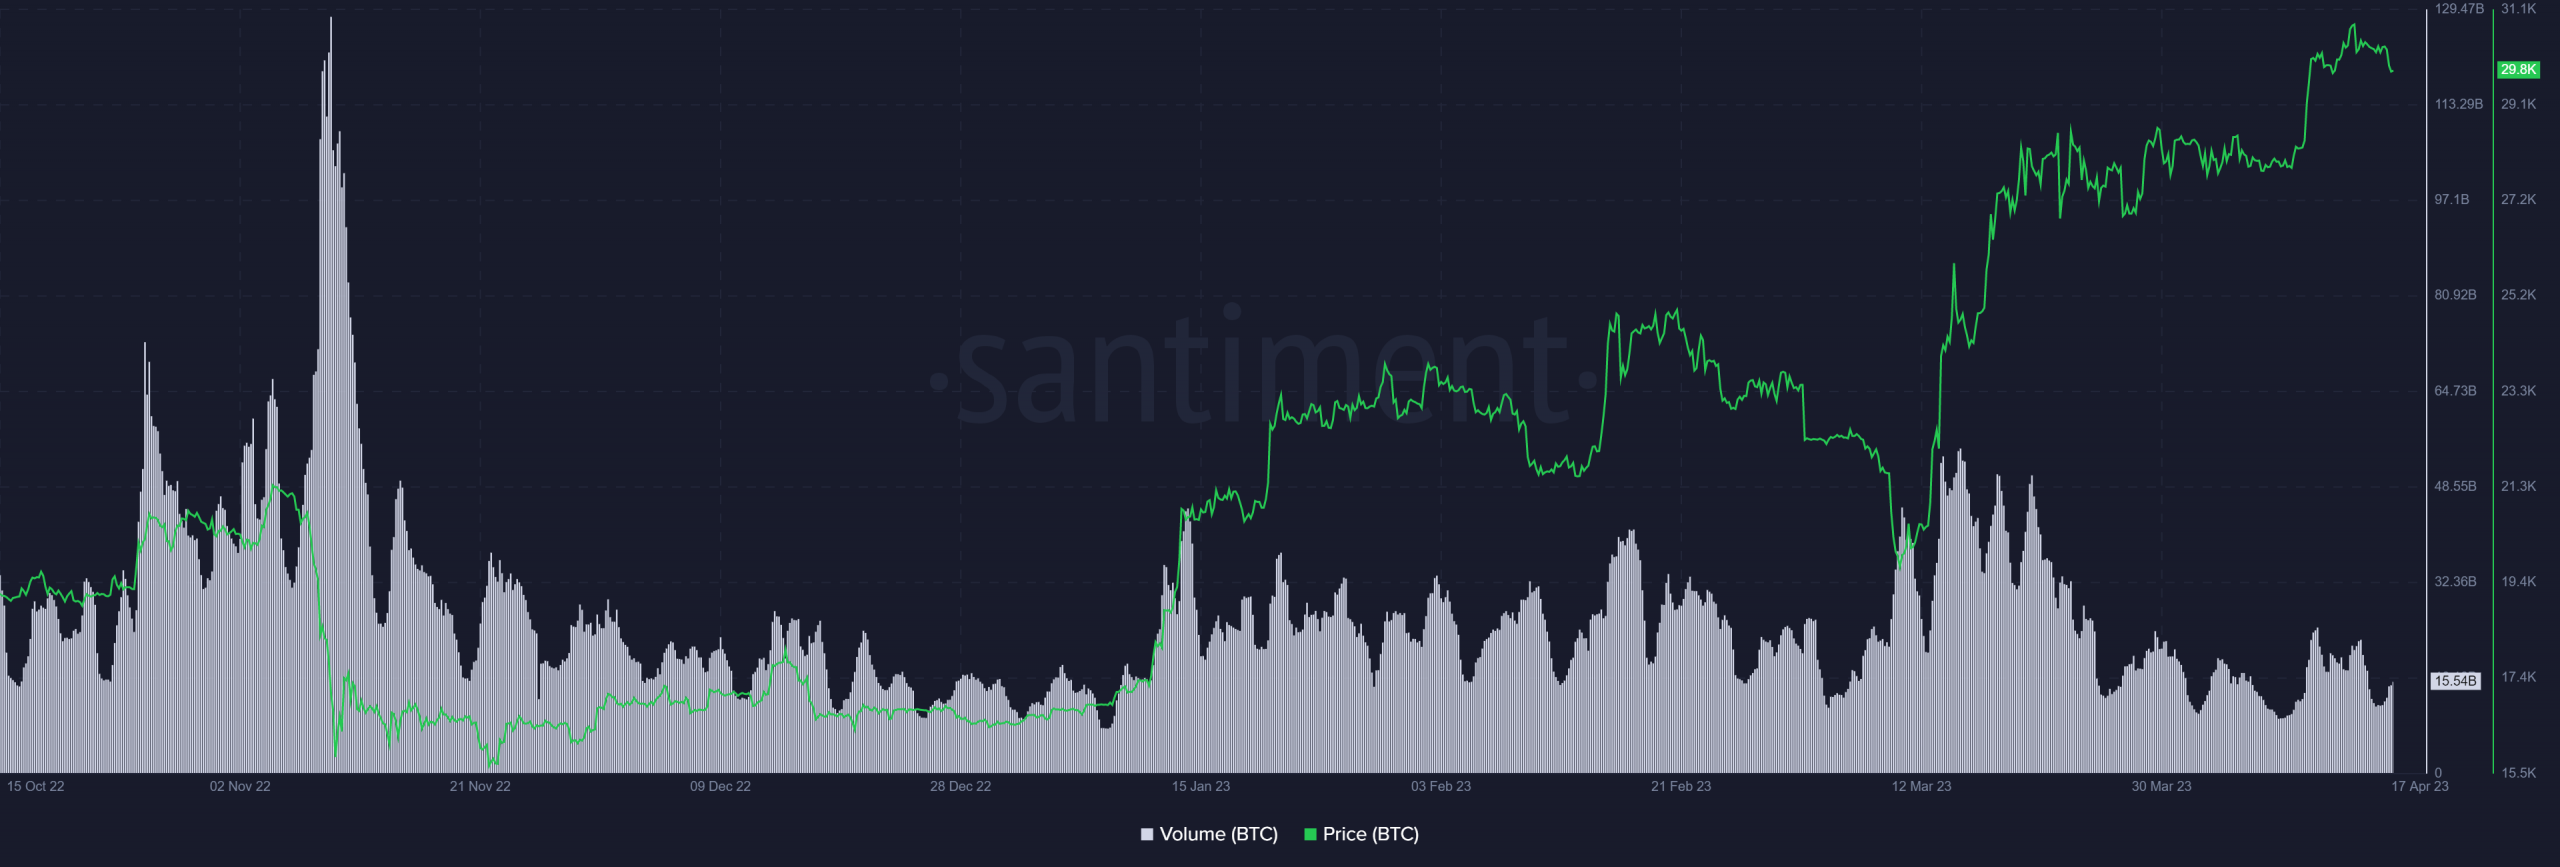
According to Santiment’s data, BTC volume showed a normal movement until 10 March, after which some significant spikes were observed.
The spike continued until approximately 11 March. During this period of spikes, BTC entered the $28,000 region but did not reach $30,000.
However, the volume metric indicated regular activity since then, and during this time, BTC crossed the $30,000 mark.
BTC’s 24-hour active address metric showed regular activity, except for spikes on 14 March and 12 April, which correlated with price movements.
Notably, on both days, the active addresses were 1.06 million, coinciding with the observed price increase. As of this writing, active addresses have decreased to approximately 869,000.

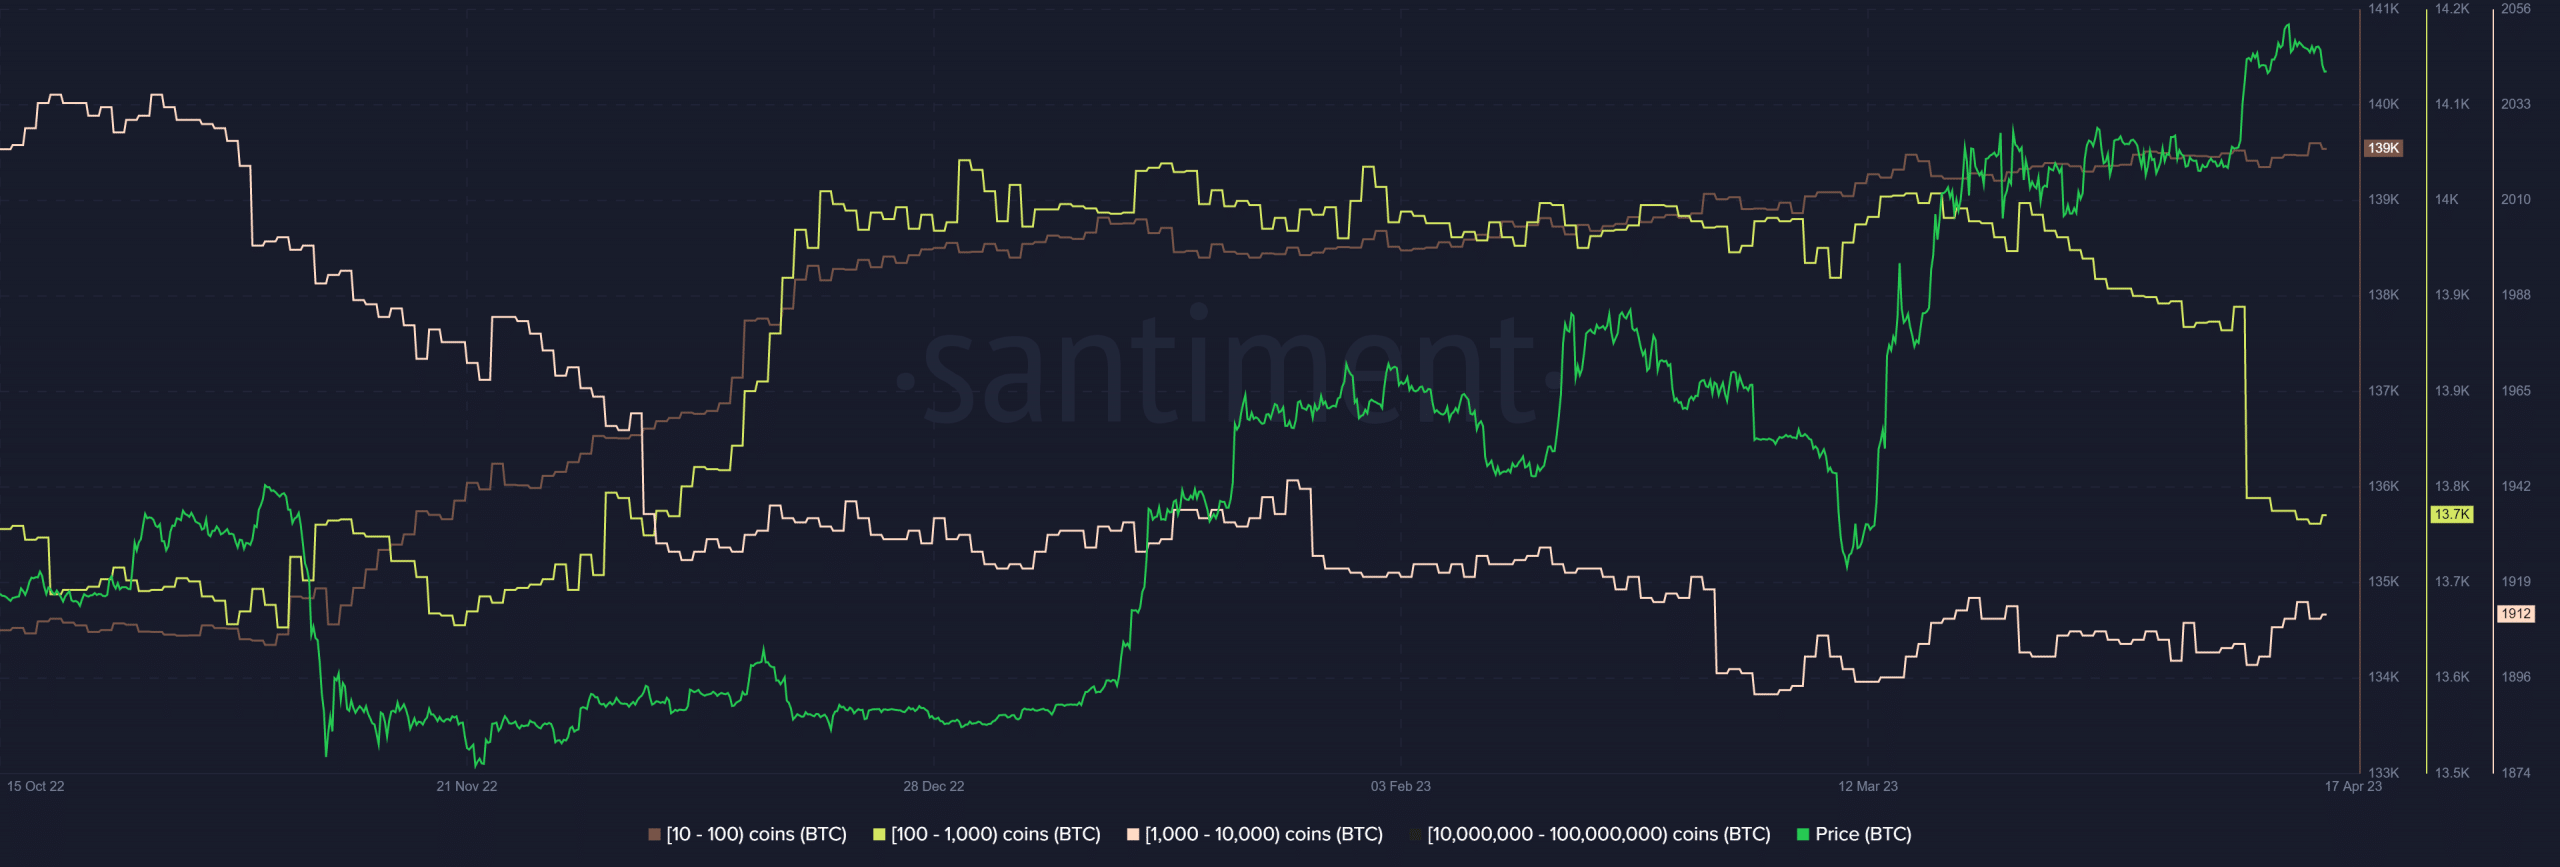
The behaviors of BTC holders indicated a strong reaction to its price movements. An analysis of investors holding 1-100, 100-1,000, and 1,000-10,000 BTC revealed periods of accumulation and dumping following price moves.
As of this writing, there was a noticeable decrease in the number of investors holding the coin as the price slightly declined.
BTC price correction on a daily timeframe
A price decline could be observed when viewing Bitcoin (BTC) on a daily timeframe chart. As of this writing, it was trading at approximately $29,900, representing a loss of over 1.5%.
The chart also indicated the immediate support levels BTC established before climbing to $30,000. The support region was located at around $27,000 and $26,000.
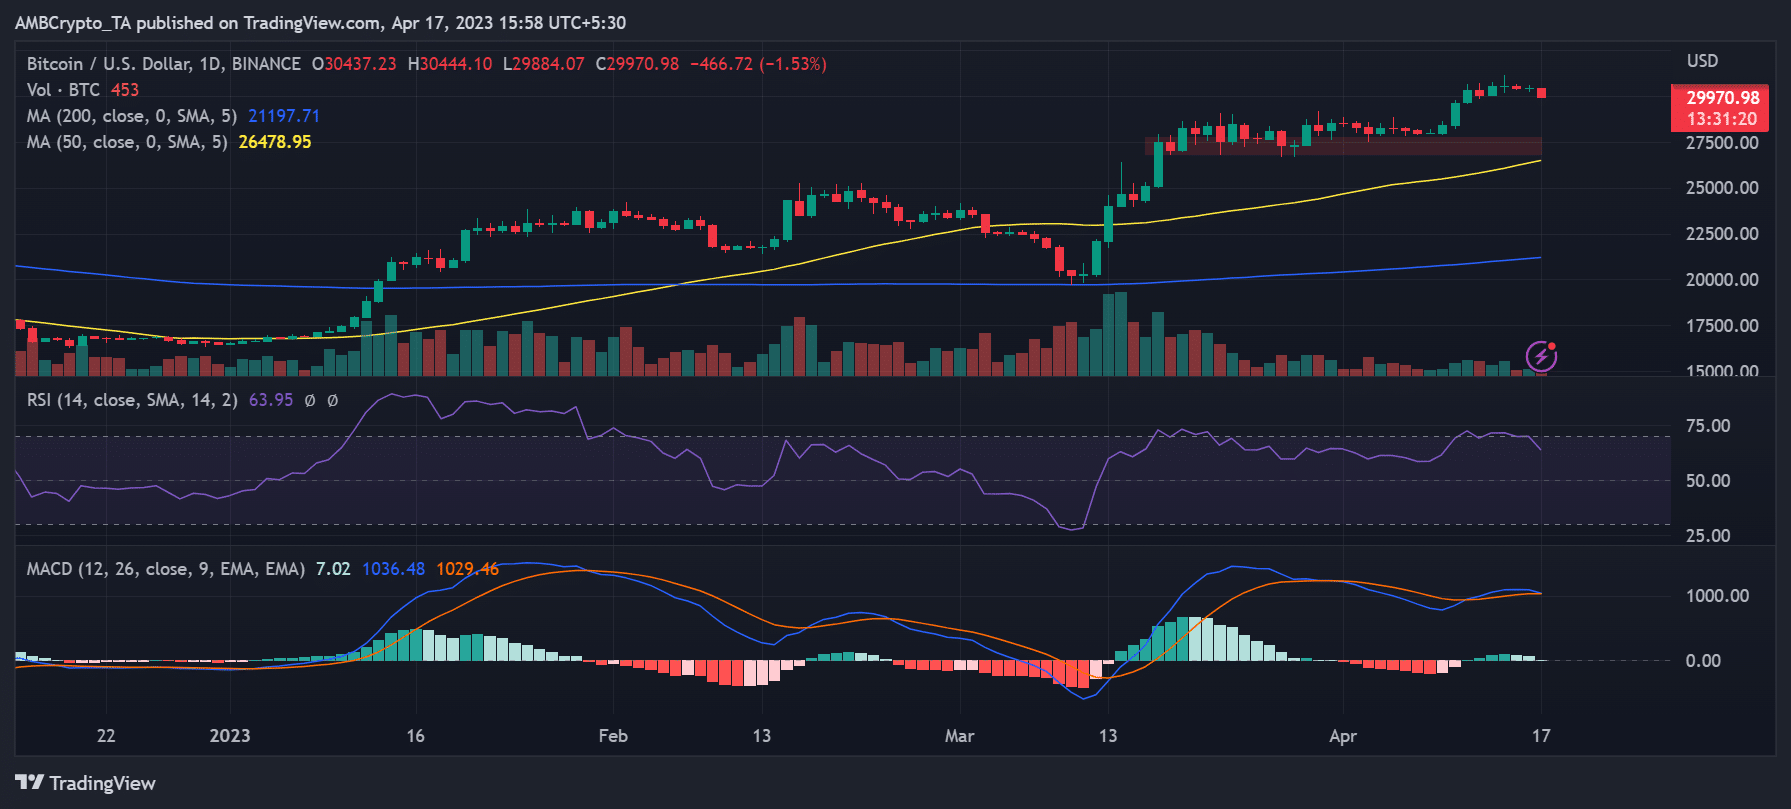
The Relative Strength Index (RSI) indicated that the current decline in price was a correction. According to the RSI, BTC had been in the overbought zone for several days. Despite the recent drop, the RSI stood at over 63, suggesting a strong bullish trend.
More sell pressure?
Following the 7 and 14 March sales of Bitcoin by the United States government, there are still over 41,000 BTCs left to be sold.
The remaining BTC will be sold in four additional batches throughout the year, and each will be sold approximately 73 days apart. According to CryptoQuant, the remaining BTCs will be sold on 26 May, 7 August, 19 October, and 30 December. While these sales may exert some pressure on the market, it is difficult to determine the exact impact they will have on the price of BTC.
How much are 1,10,100 BTCs worth today?
Based on the key metrics analyzed, FOMO may have contributed to the increase in BTC’s price. A further price correction may be possible, but a rally could be on the horizon after the corrections are completed.