How WIF’s price outperformed Bitcoin on this important front
WIF held its bullish market structure better than BTC as both fell. However, that's not the whole story...

- WIF’s market structure remained bullish despite the current market dump
- Despite BTC’s bearish market structure, it held its value better than WIF
As April’s losses spilled into May, not all crypto-assets have managed the market dump well. This wasn’t helped by the fact that Bitcoin [BTC] cracked below its two-month price range of $60.8k and $72.7k on the charts.
As expected, BTC’s drop below its range exerted more pressure on the market’s altcoins. In fact, some altcoins shed over 30% or 40% of their values. However, some defied those trends and held their bullish market structures.
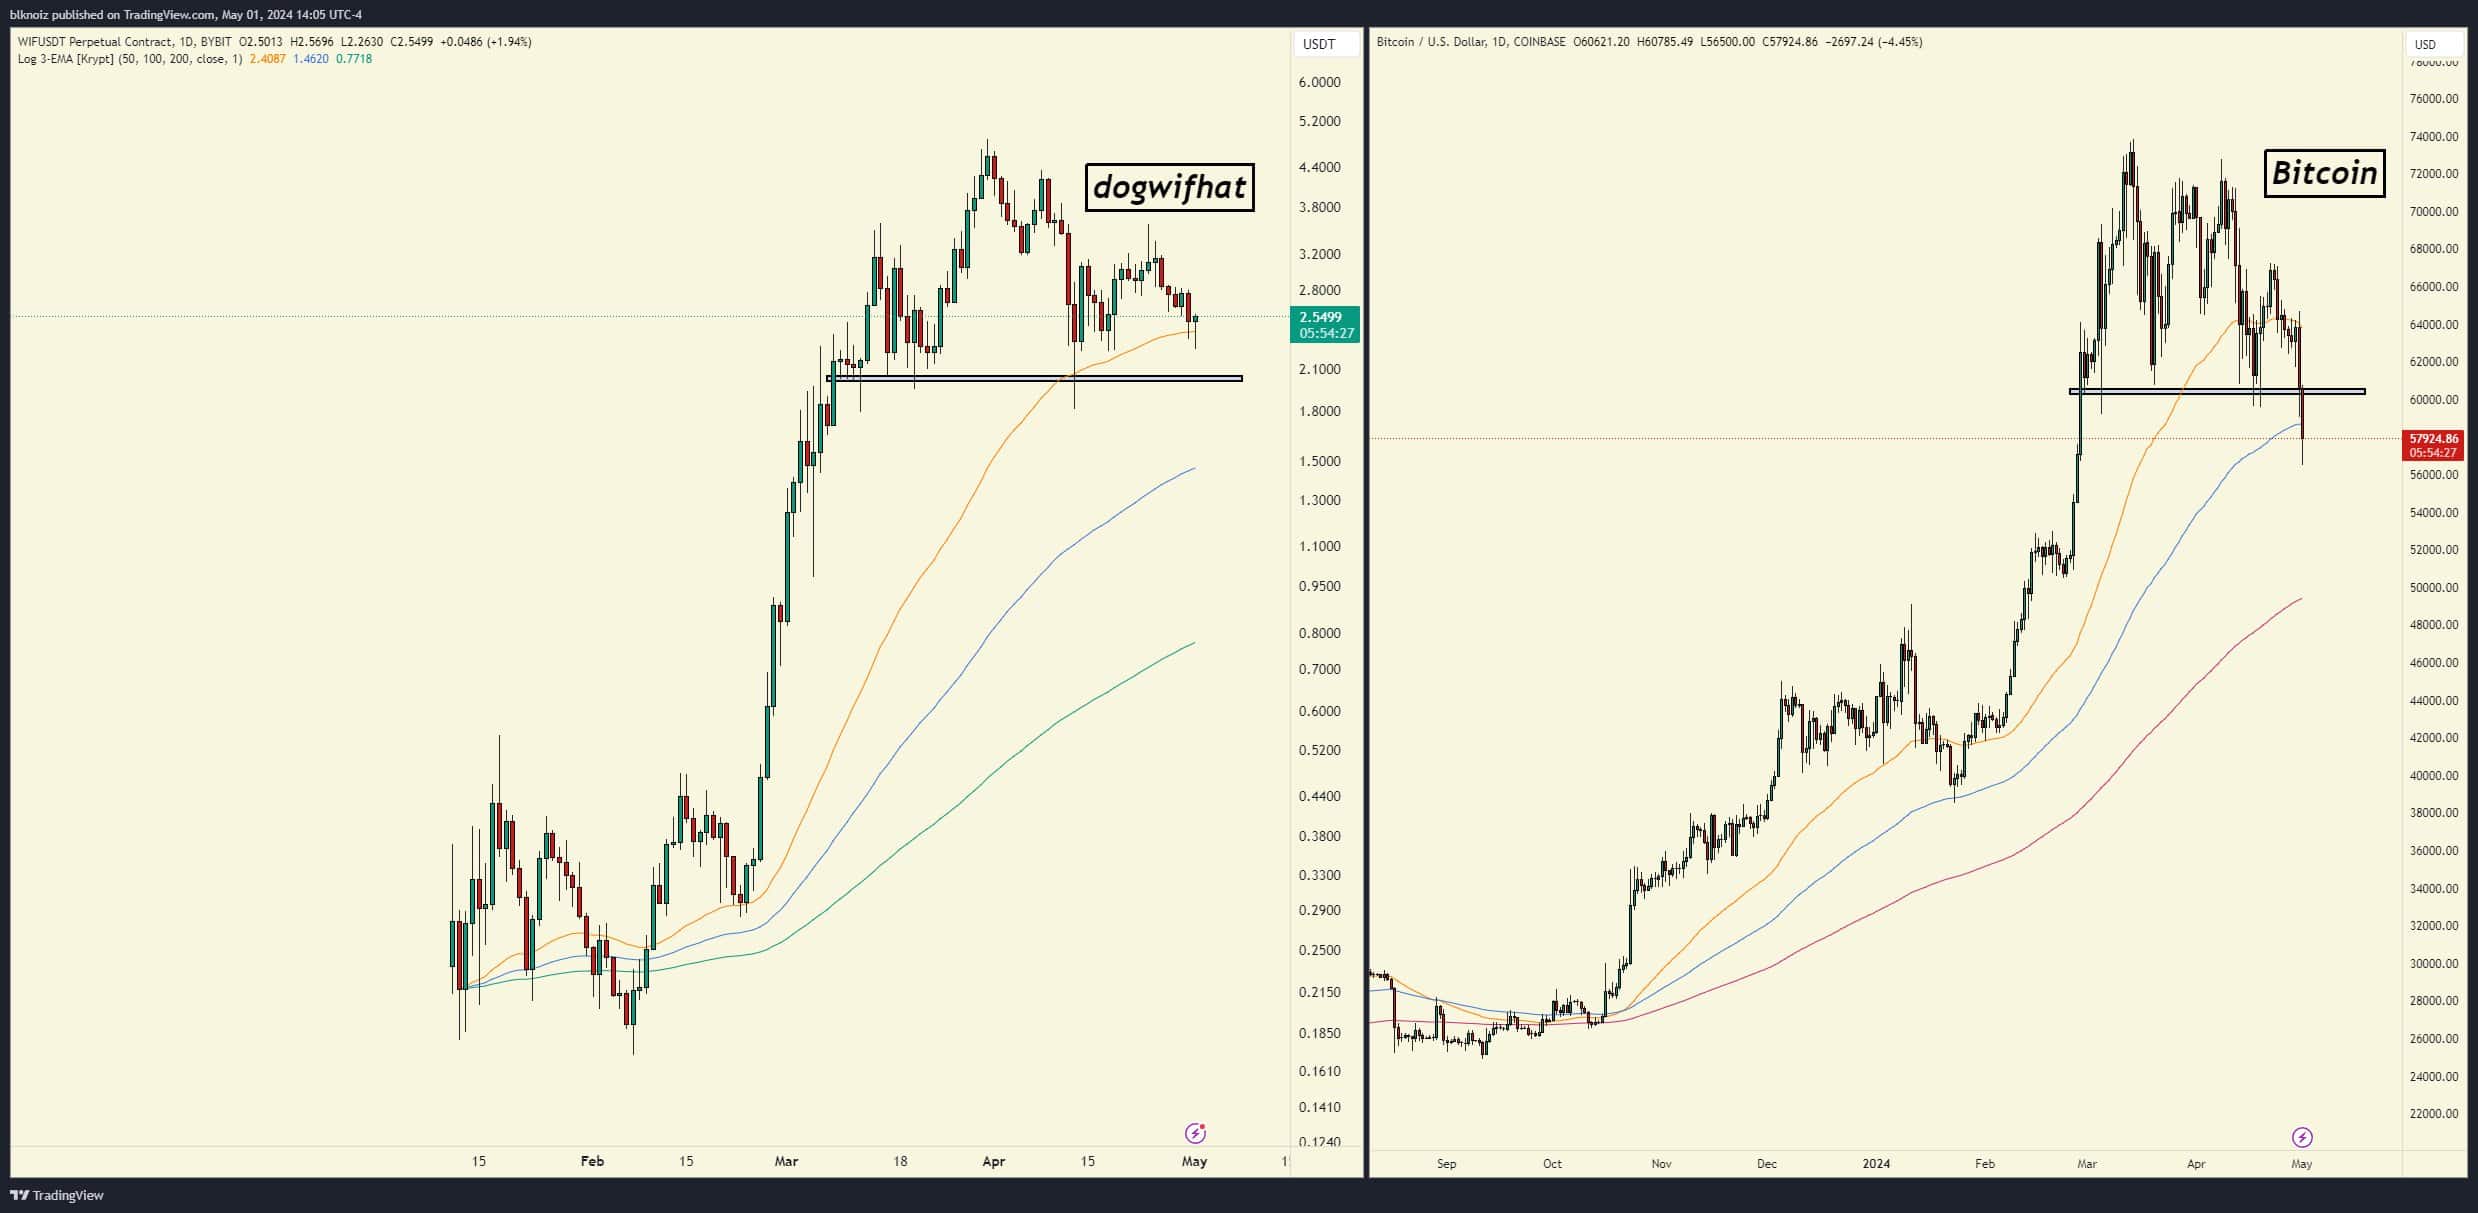
Crypto-analyst Ansem singled out memecoin dogwifhat [WIF] as an outlier during the market slump. In fact, he reiterated that WIF maintained its bullish market structure, unlike BTC.
“On the left is dogwifhat, the leading meme for this cycle, on the right is bitcoin. Which held bullish market structure better on this pullback?”
For the unfamiliar, market structure is a snapshot of the token’s price action on the charts, and it could be bullish or bearish.
Based on the chart, WIF has consolidated above the $2-level since March and the intensified sell pressure didn’t push it below the support. WIF’s price action was above the key support and hovered above key moving averages (colored lines). Since it’s still in an overall uptrend, WIF’s market structure is considered bullish.
For the BTC chart, the price dropped below the two-month support, around $60k, and was below one of the moving averages. Based on technical analysis (TA), this meant BTC broke its market structure and flipped bearish.
So, from a TA perspective, specifically based on market structure, WIF withstood the market dump better than BTC.
Bitcoin held its value better than WIF
However, when traced from its all-time high to its current levels, WIF shed twice as much value compared to BTC. Notably, WIF hit a record high of $4.86, but was trading at $2.75 at press time, which translated to a 44% drop. On the contrary, based on the press time value above $58k, BTC was down about 20% from its record high of $73.7k.
WIF fell twice as hard against BTC based on the percentage of value dropped from its record highs.
That being said, WIF’s bullish market structure means that despite the aforementioned dump, it might recover faster when the market improves.


