Analyzing Celestia’s bullish pattern – Will TIA rally by 35% next?
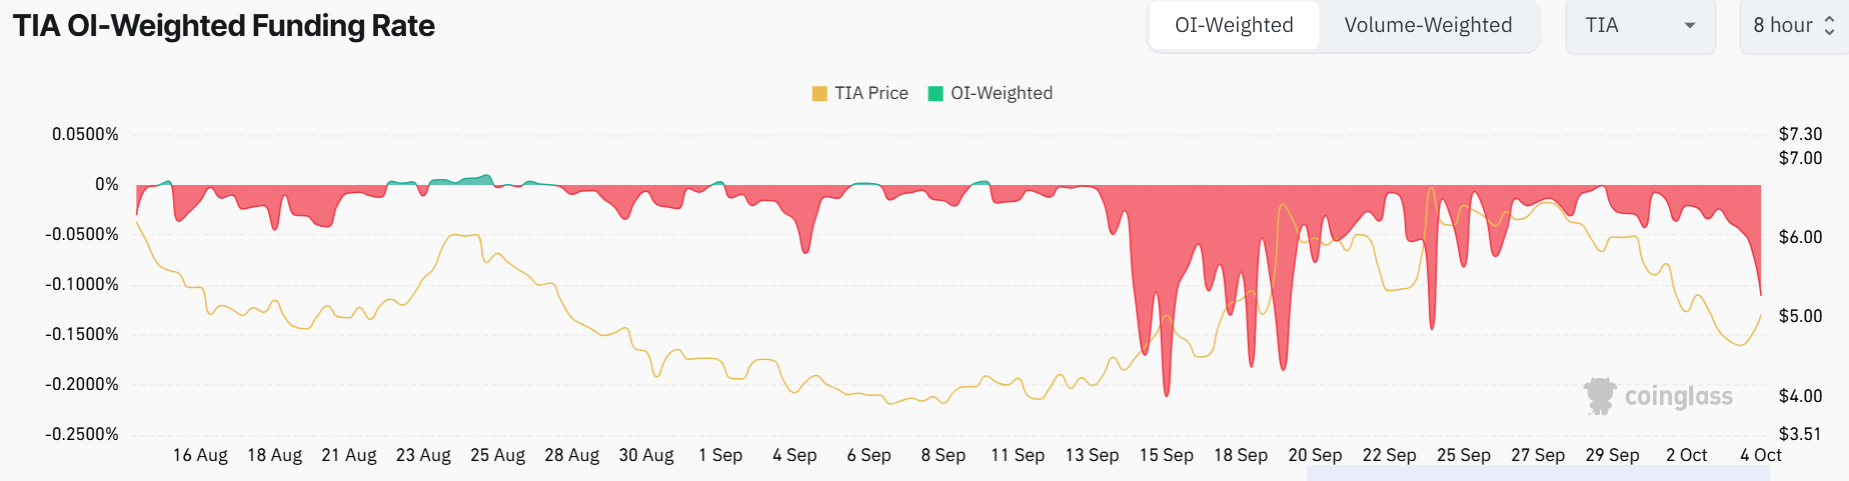
TIA’s funding rates have been predominantly negative since early September showing strong bearish sentiment.

- Celestia rallied by more than 12% on 4th October outperforming most coins across the crypto market.
- TIA has formed a bullish continuation pattern on the daily chart but trading volumes are needed to support a breakout.
Bitcoin [BTC] and the cryptocurrency market recovered slightly on 4th October in a possible “buy the rumor” event as traders anticipated the release of US jobs data. Celestia [TIA] led this recovery with a 12% gain in 24 hours to trade at $5.19 at press time.
Despite these recent gains, TIA was still down by around 20% in the last seven days. As bullish sentiment around TIA builds, will it sustain the uptrend, or will profit takers trigger a price correction?
Celestia’s bullish pattern
Celestia has formed a cup and handle pattern on the daily chart, which usually shows a bullish continuation and a potential price rally.
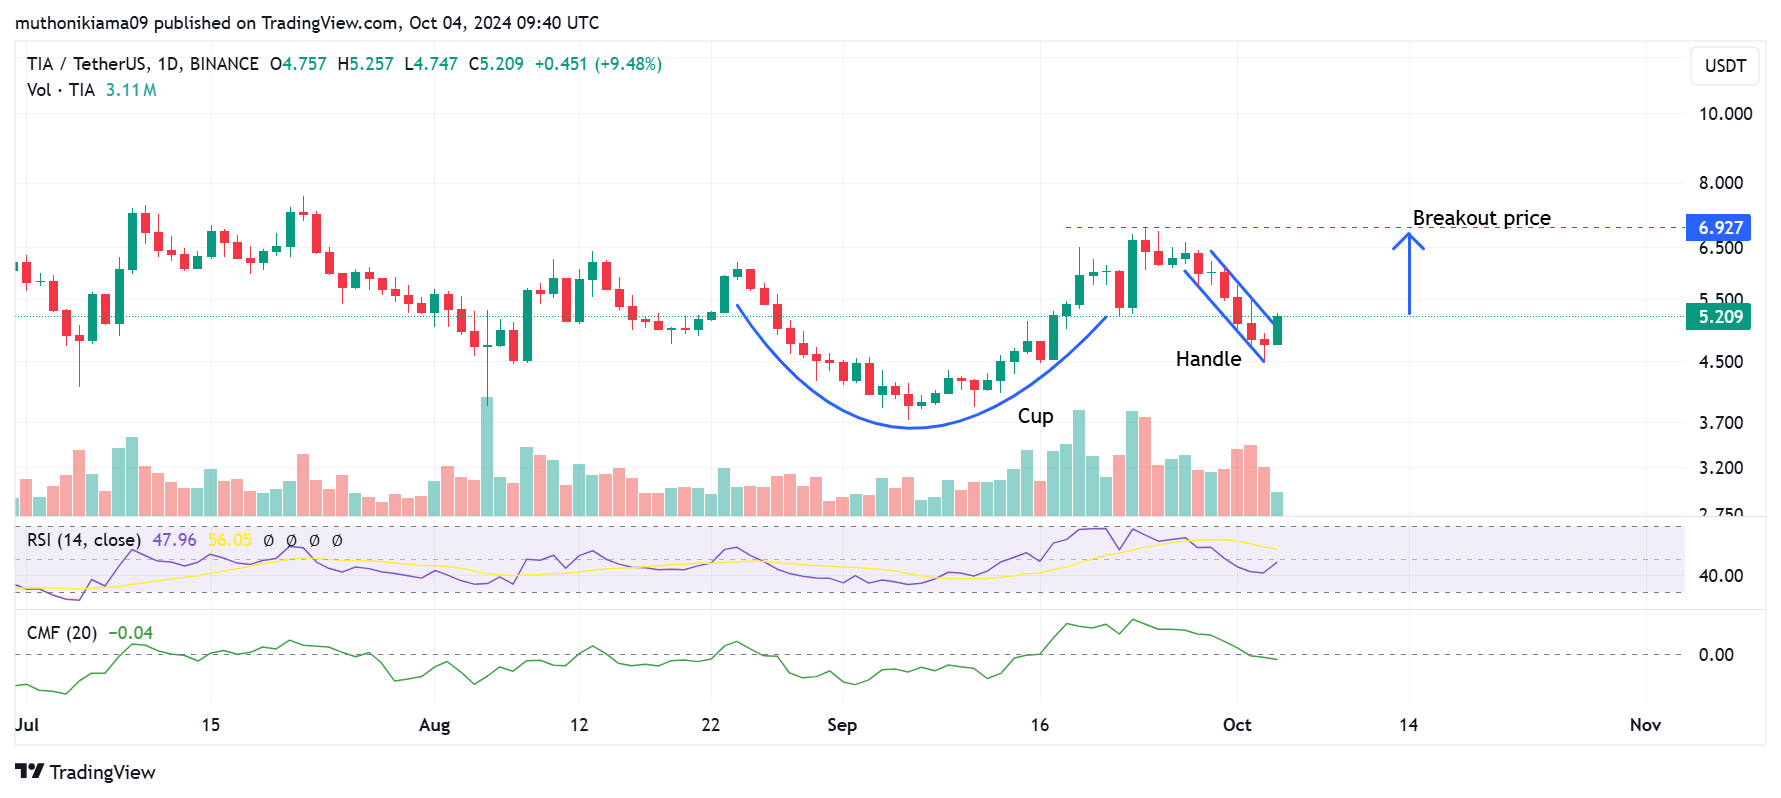
For this pattern to hold, it needs to be accompanied by a rise in buying volumes. The volume histogram bars have flipped green suggesting that buying activity has increased, and surpassed selling activity.
However, a strong buy signal will be formed when the Relative Strength Index (RSI) crosses above the signal line. Currently, the RSI line is tipping north, but bullish momentum is yet to be confirmed to support further gains.
A similar outlook is also seen in the Chaikin Money Flow (CMF), which has a negative value of -0.04. This indicator shows that selling pressure is higher than buying pressure. A crossover to the positive side could support a breakout from this pattern.
If the bullish thesis holds, TIA will likely gain by 35% from its current price to test resistance at the breakout level of $6.92. A bullish breakout from this pattern will set the stage for a steeper uptrend.
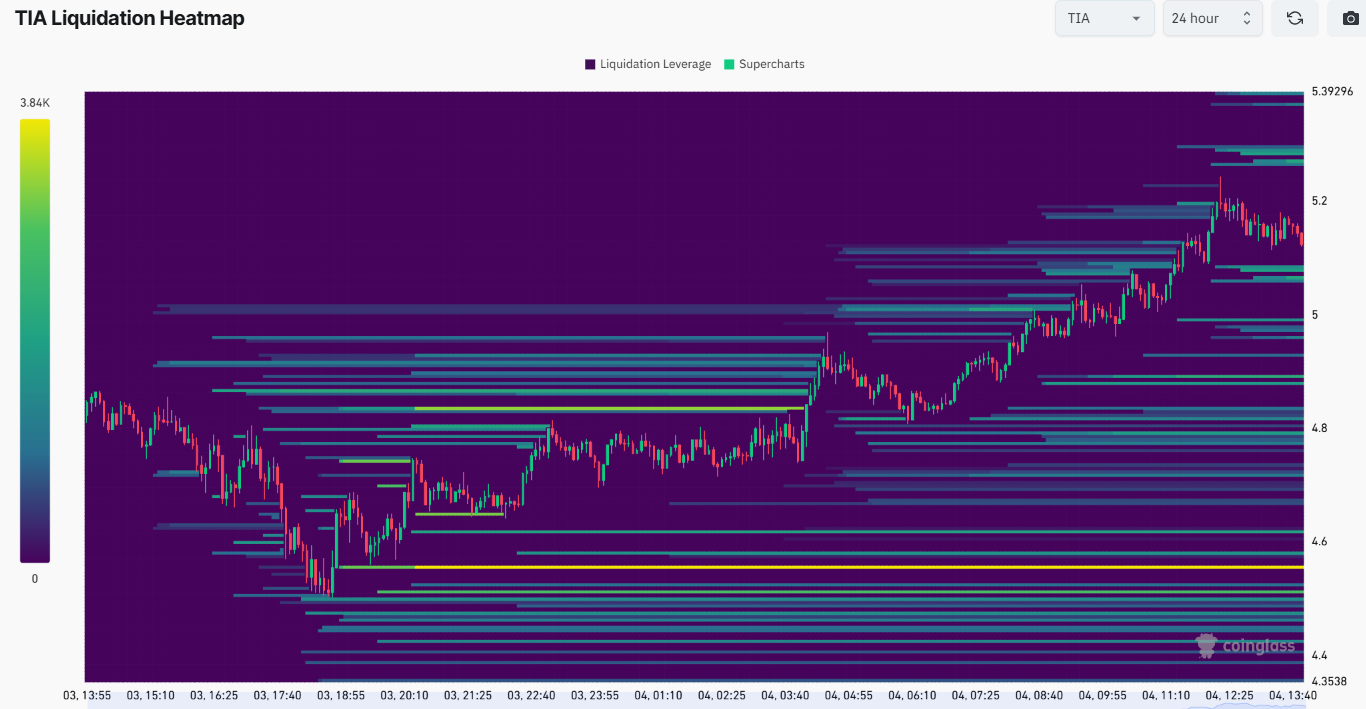
Analyzing liquidation data
Celestia’s liquidation heatmap shows that there are significantly more short positions than long positions on TIA. This data suggests that more traders are betting on further price drops, which shows strong bearish sentiment.
A further analysis of the funding rates further strengthens this bearish thesis. TIA’s funding rates have been predominantly negative since early September, suggesting that traders are not confident in TIA’s extended rally.
Is your portfolio green? Check out the TIA Profit Calculator
When funding rates remain negative for a long time, it could drive prices lower if the market sentiment does not shift to positive.
Additionally, open interest remained elevated at more than $200M at press time per Coinglass. This suggests that traders who have placed short bets on TIA are maintaining their positions despite the recent recovery in prices.


