Analyzing how Tron holds its ground in the bear market
Tron adoption was on the rise as both its total accounts and total transactions reached new highs. TRX was up by 6%, and a few indicators remained bullish.

- Apart from network activity, TRX’s development activity also surged last week
- RSI entered the overbought zone, which raised a red flag
Tron [TRX] managed to hold its ground better than several others during the bear market as its price chart remained green. A possible reason behind this might be the blockchain’s increase in adoption and usage during the bear market. The latest data revealed that Tron reached a new milestone, which reflects its high network activity.
Read Tron’s [TRX] Price Prediction 2023-24
Tron adoption is on the rise
While most cryptos registered drops in their prices, TRX managed to behave differently. As per CoinMarketCap, TRX was up by nearly 6% in the last seven days.
At the time of writing, it was trading at $0.08344 with a market cap of over $7.4 billion, making it the 11th largest crypto. Some of the credit for this performance can be given to the blockchain’s network statistics.
#TRONICS, we are setting benchmarks in the decentralized world! 🌐
Total Transaction?
✨ 6.4B!Total Accounts?
✨ 184M!With #TRON, the sky isn't the limit, it's just the beginning. 🚀 https://t.co/n3w8ZFpExp
— TRON DAO (@trondao) September 15, 2023
TRONSCAN’s data revealed that the blockchain’s total accounts reached 184 million. Thanks to the increase in the number of accounts, Tron’s total transactions also surged and touched 6.4 billion, reflecting high usage of the network.
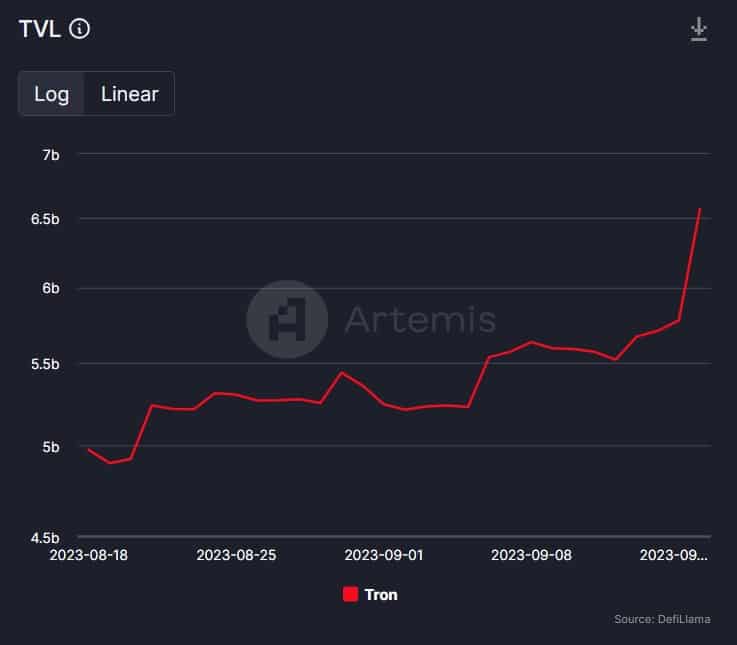
Artemis’ data revealed that the blockchain also excelled in the DeFi space. This was evident from the sharp rise in its TVL over the last few days.
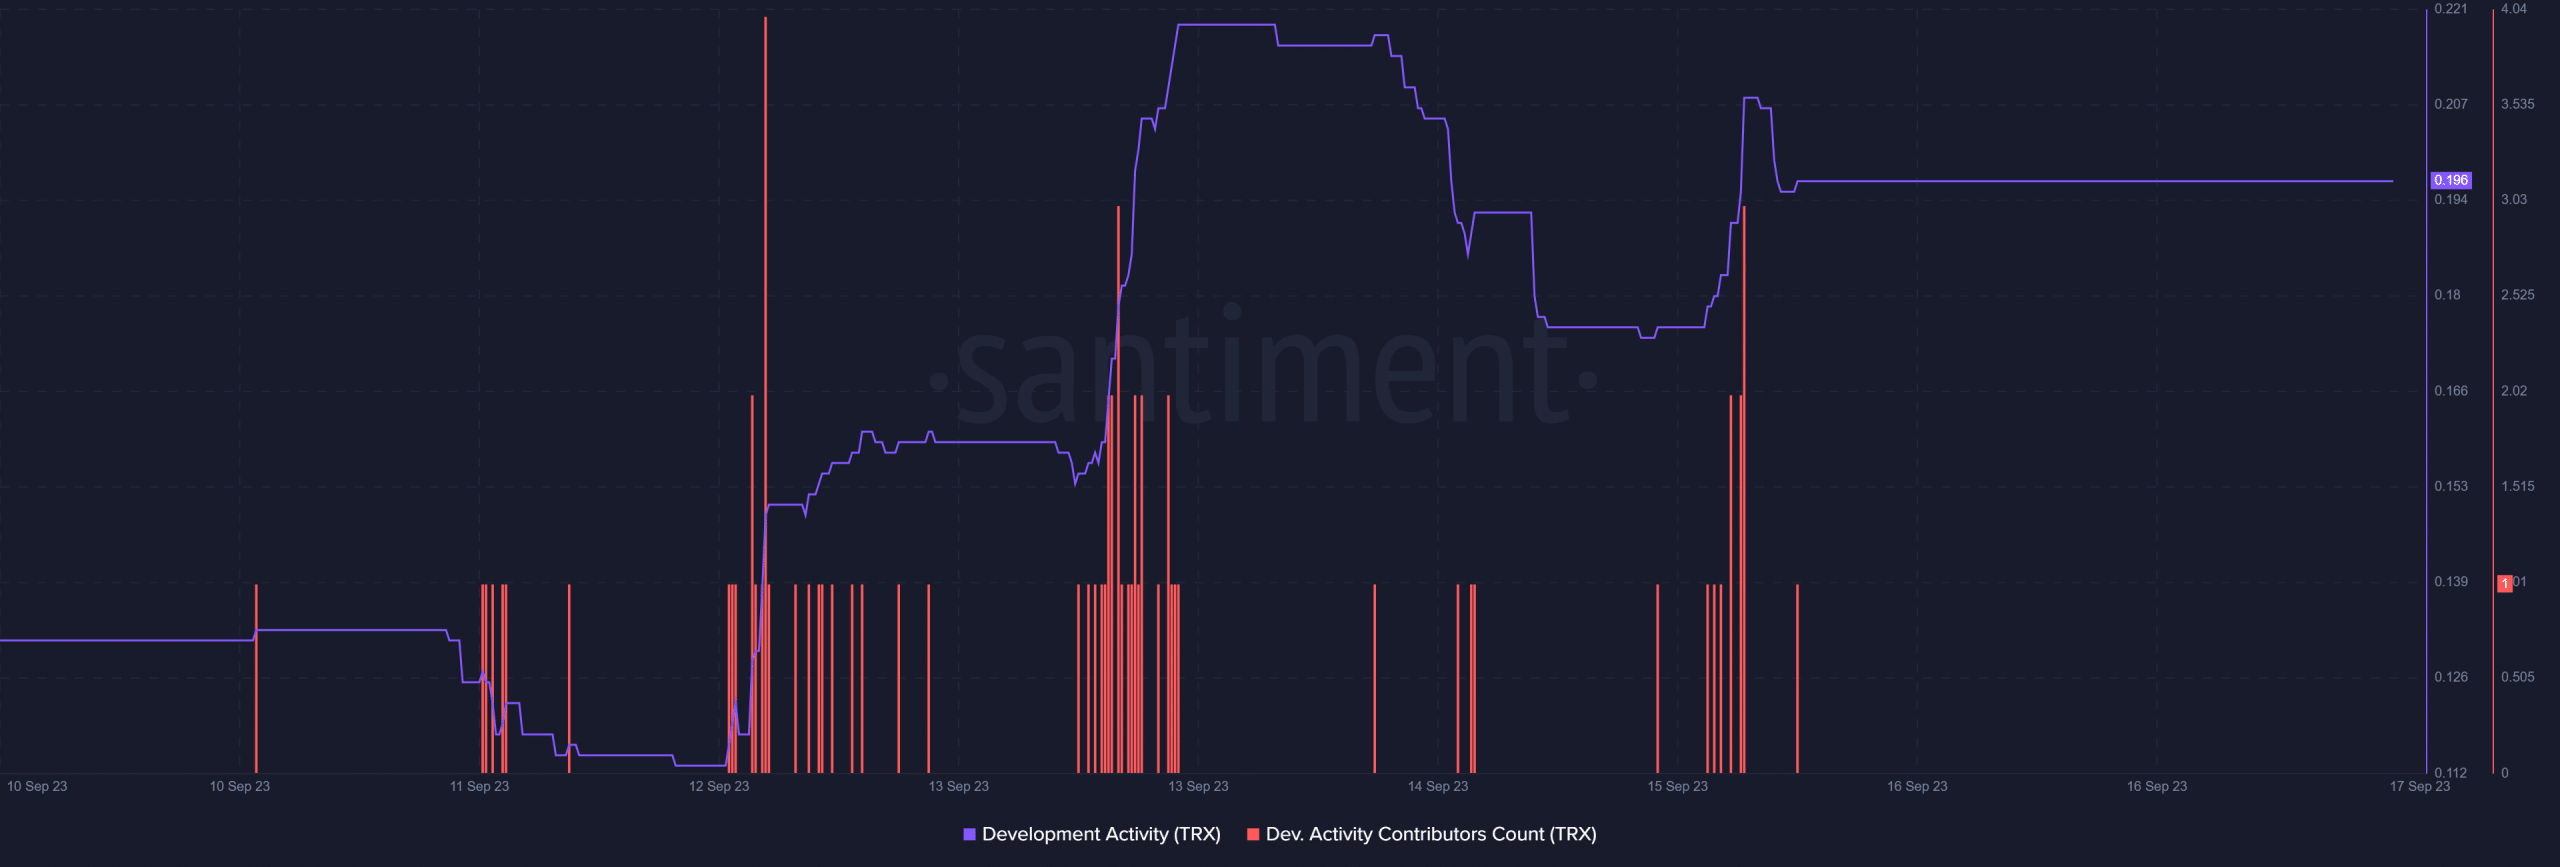
Not only was the blockchain’s network activity up, but the same was true for its development. Santiment’s chart revealed that TRX’s development activity surged substantially last week.
Tron’s development activity contributor count also spiked quite a few times, which was a positive signal, reflecting developers’ efforts to improve the network.
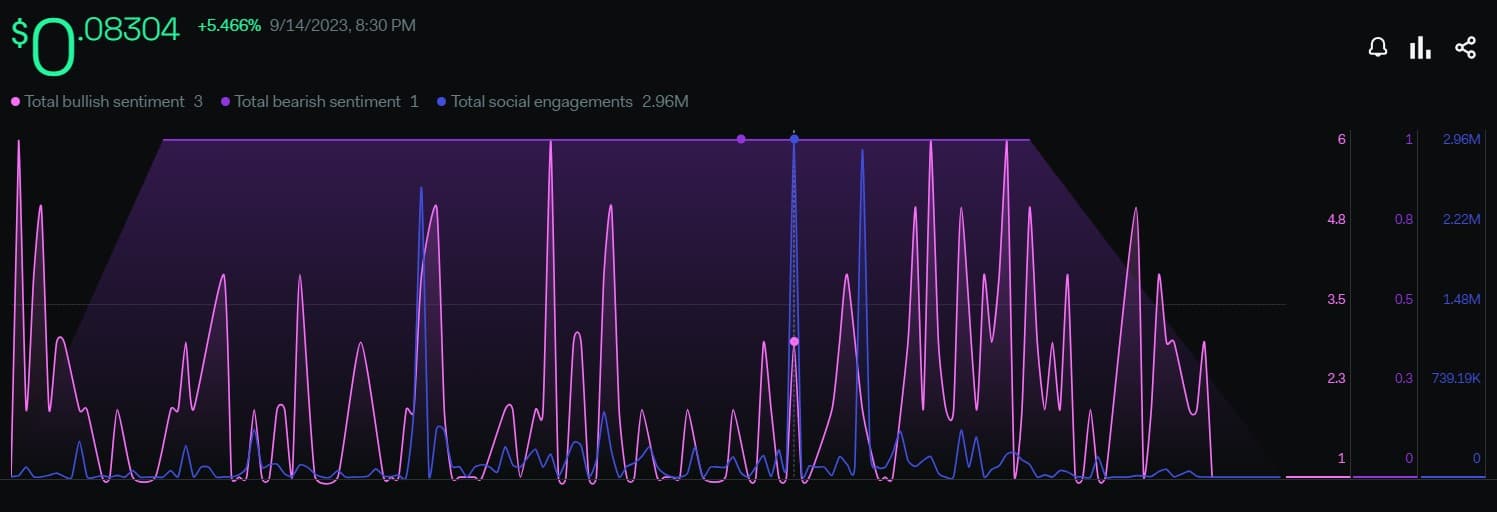
Thanks to the blockchain’s commendable performance, its social engagement surged by more than 76% in the last week. However, it was surprising to see that, despite a green weekly chart, bullish sentiment around the token dropped by 28%.
In fact, this was accompanied by a rise in bearish sentiment, which looked concerning for TRX.
Is your portfolio green? Check the TRX Profit Calculator
Looking forward
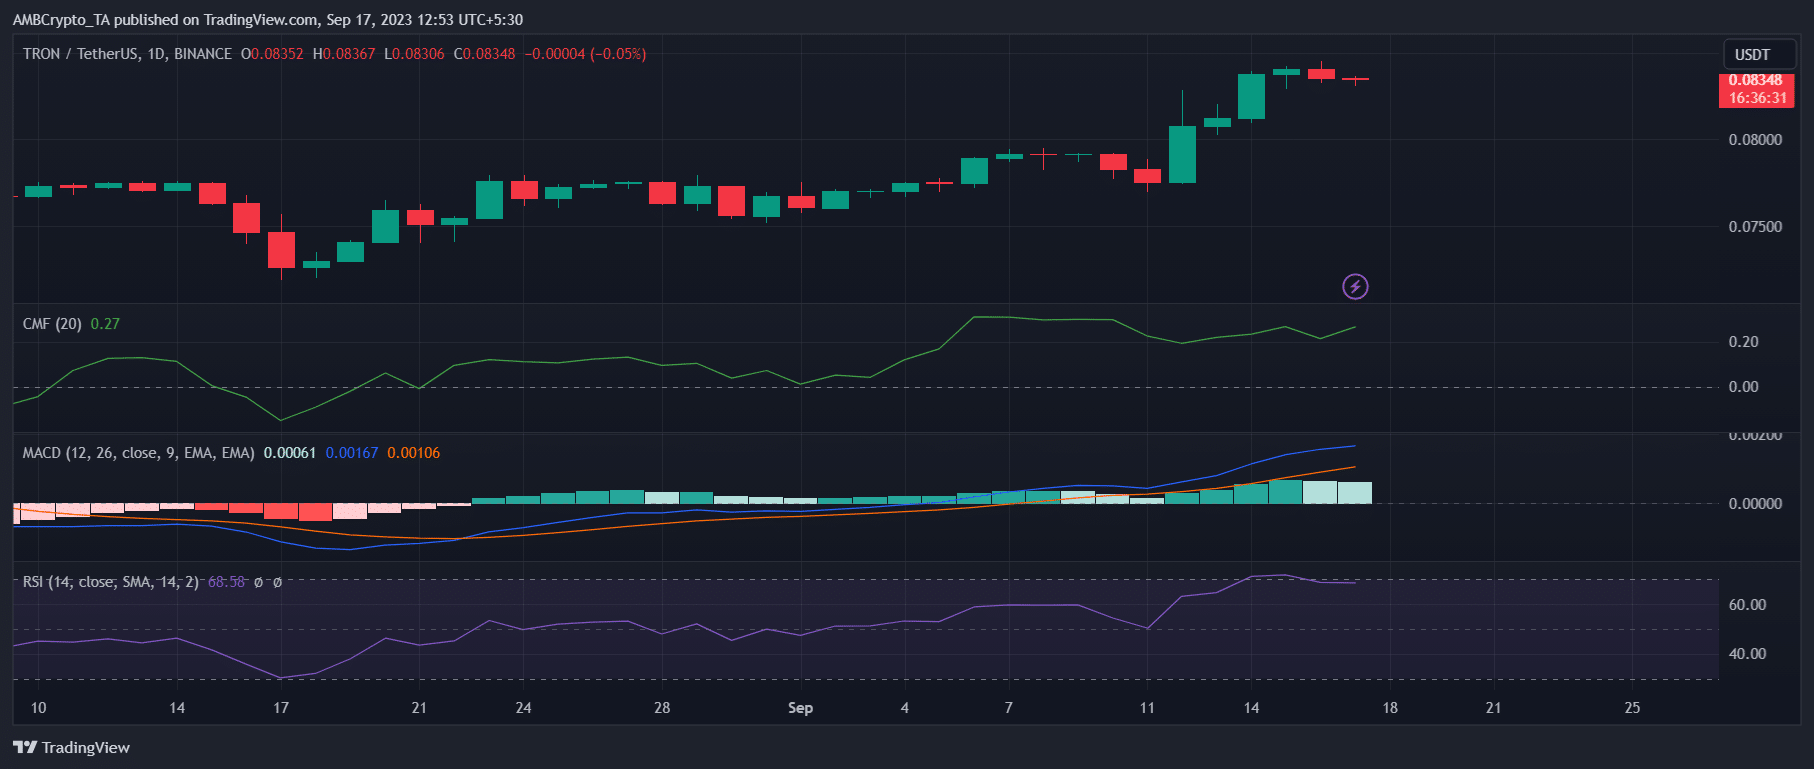
A look at TRX’s daily chart gave an idea of why bearish sentiment around the token surged. Tron’s Relative Strength Index (RSI) entered the overbought zone. This can increase selling pressure on TRX and, in turn, push its price down.
Nonetheless, the rest of the indicators were bullish. TRX’s Chaikin Money Flow (CMF) remained high. Its MACD displayed a clear bullish upper hand in the market.