Altcoin
Analyzing Tron’s network growth – A bearish sign for TRX?
While the month-on-month data is positive, daily network activity on Tron is shrinking.
- The monthly active users and transactions on the Tron network hit a peak last month amid the launch of SunPump.
- However, daily activity slowed down and started weighing on TRX’s price performance.
The Tron [TRX] blockchain saw a massive surge in usage after the SunPump memecoin launchpad went live last month. Per TokenTerminal, monthly fees, transactions, and active users on Tron soared shortly after its launch.
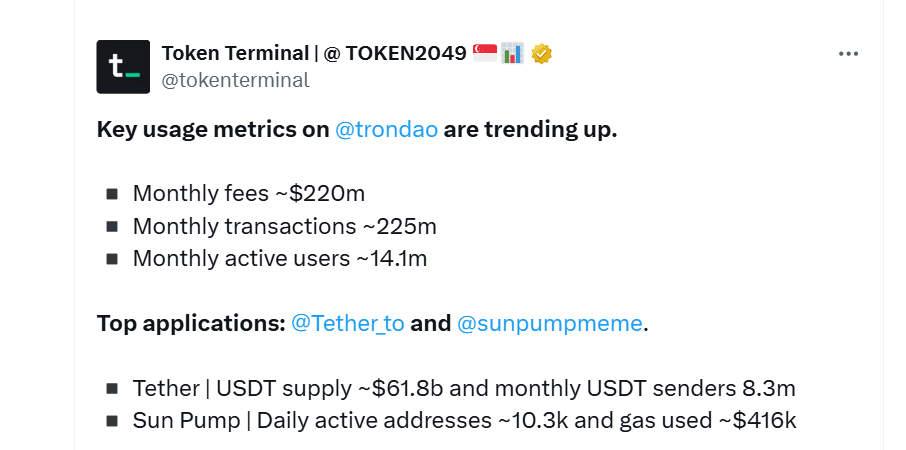
Source: X
USDT supply on Tron also contributed to this growth, as it has jumped from $48 billion at the beginning of the year to $68.9 billion. Tron now controls more than half of USDT’s $118 billion market capitalization.
However, when it comes to SunPump, the growth trajectory has weakened. The number of daily active addresses on this protocol has dropped from the August peak of 73,000 to 10,300 addresses.
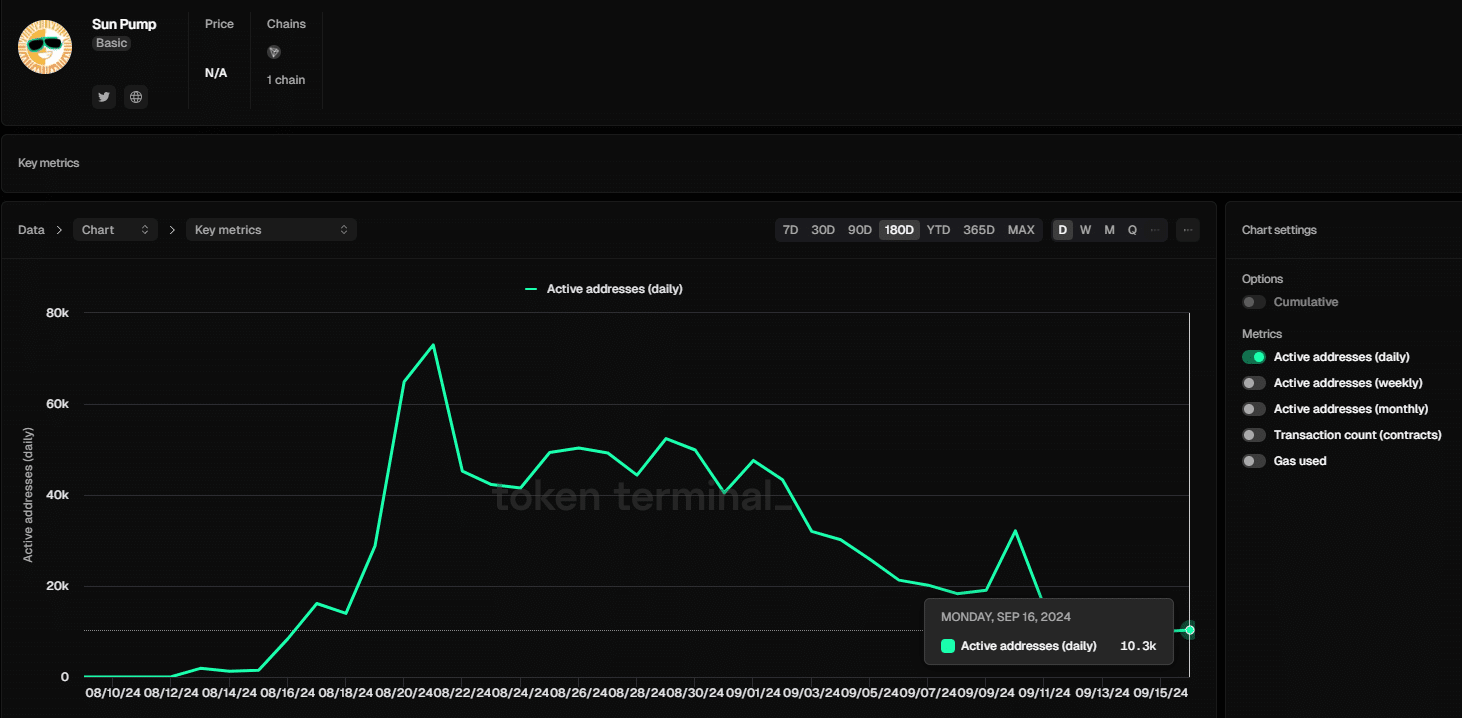
Source: TokenTerminal
The cooling network activity is further seen in declining decentralized application (dApp) volumes.
Per DappRadar, dApp volumes on Tron have decreased from $73M at the start of the month to $58M.
Within the same period, the number of Unique Active Wallets (UAWs) dropped by more than half from around 15,000 to 6,000 showing fewer users on the blockchain.
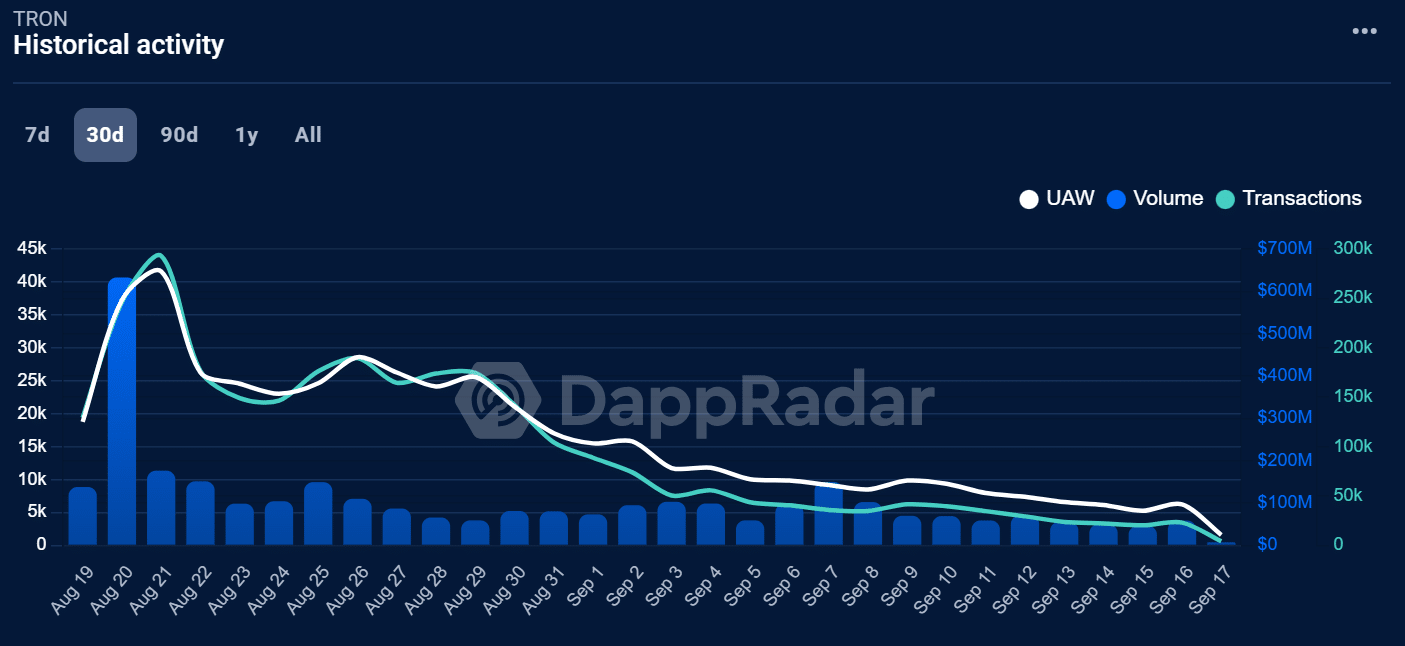
Source: DappRadar
The shrinking network activity has seen TRX price fail to make significant gains, and it has instead succumbed to bearish pressure.
TRX Open Interest hits one-month low
TRX was trading at $0.15 at the time of writing with low volatility, as it oscillated between $0.149 and $0.51.
Data from Coinglass showed that Tron’s Open Interest has been on a downward trajectory since late August. This metric recently dropped to a one-month low.
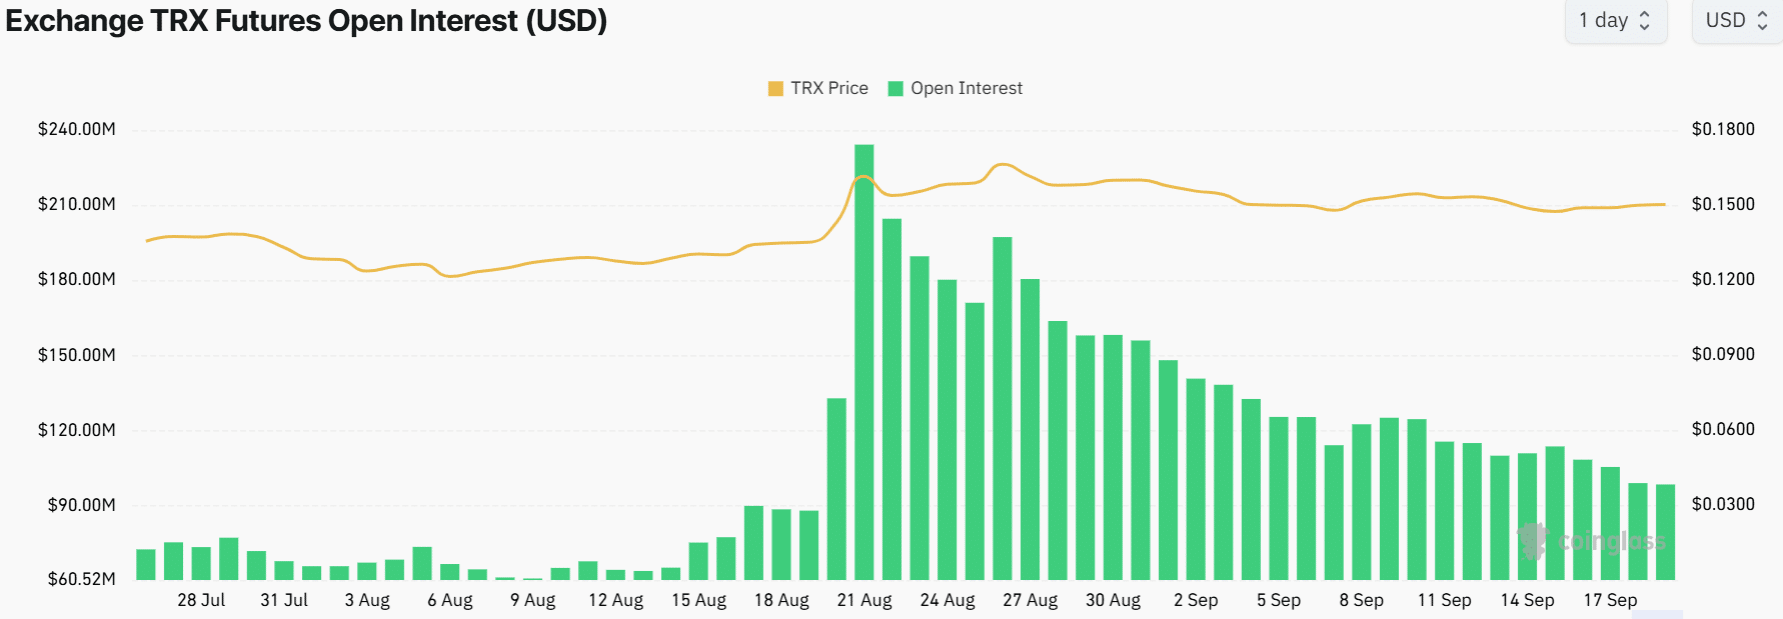
Source: Coinglass
The drop in Open Interest amid price inaction suggests that traders are not opening new positions on TRX, and are closing the existing ones.
The inactivity around TRX is also seen in the Relative Strength Index (RSI), which is at a neutral level of 50.
Traders need to watch out for a breakout of the RSI line above the signal line, as that could indicate a buy signal and trigger bullish momentum.
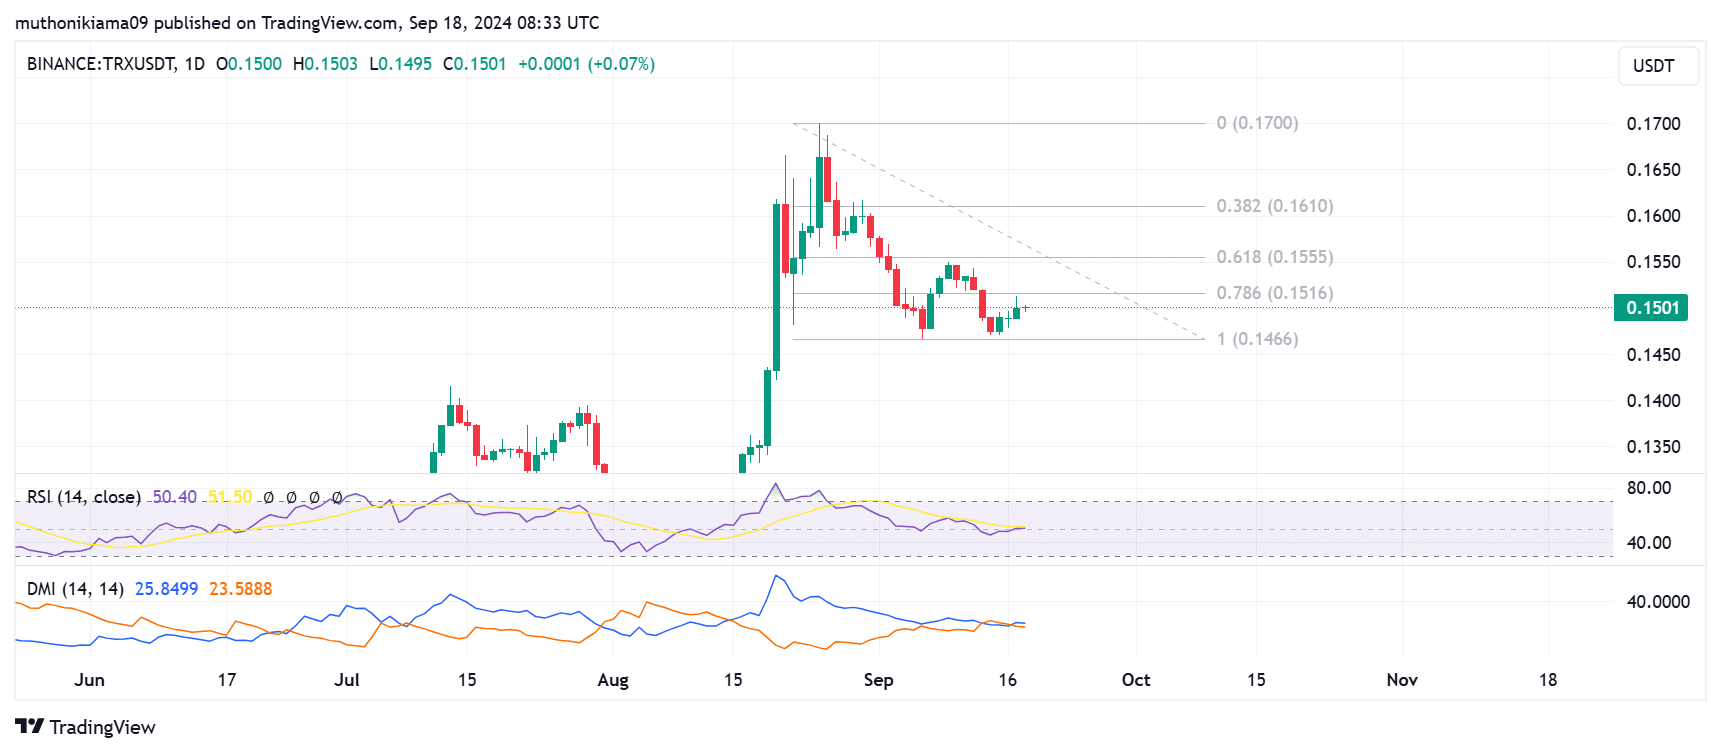
Source: TradingView
A bullish divergence appeared in the Directional Movement Indicator (DMI) after the positive DMI crossed over above the negative DI. This suggests that TRX could be entering an uptrend.
If buyers step in, the resulting gains will see TRX aim for resistance at the 0.382 Fibonacci level. The last time that TRX broke this resistance saw the price rally to a three-year high at $0.17.
Read Tron’s [TRX] Price Prediction 2024–2025
It is important to note that 94% of TRX traders are In The Money per IntoTheBlock data.
Therefore, if TRX continues to show weakness, these traders might decide to sell and minimize losses, creating more bearish pressure on the altcoin.