ANKR Price Prediction – Can the altcoin rebound after March?

Crypto-infrastructure provider Ankr has seen major investments and partnerships over the last few months. Hence, evaluating its utility token via an ANKR price prediction is crucial for gauging recent and potential price performance for long-term holders.
One of Ankr’s products, the RPC (Remote Procedure Call) endpoint, saw massive investments from Binance Labs in 2022. In fact, it is powering several startups.
So, how has ANKR faired throughout Q1 and the first half of Q2? What should long-term holders expect in Q2? Let’s find some answers from the daily charts.
Read Ankr [ANKR] Price Prediction 2023-24
Will ANKR rise from March lows?
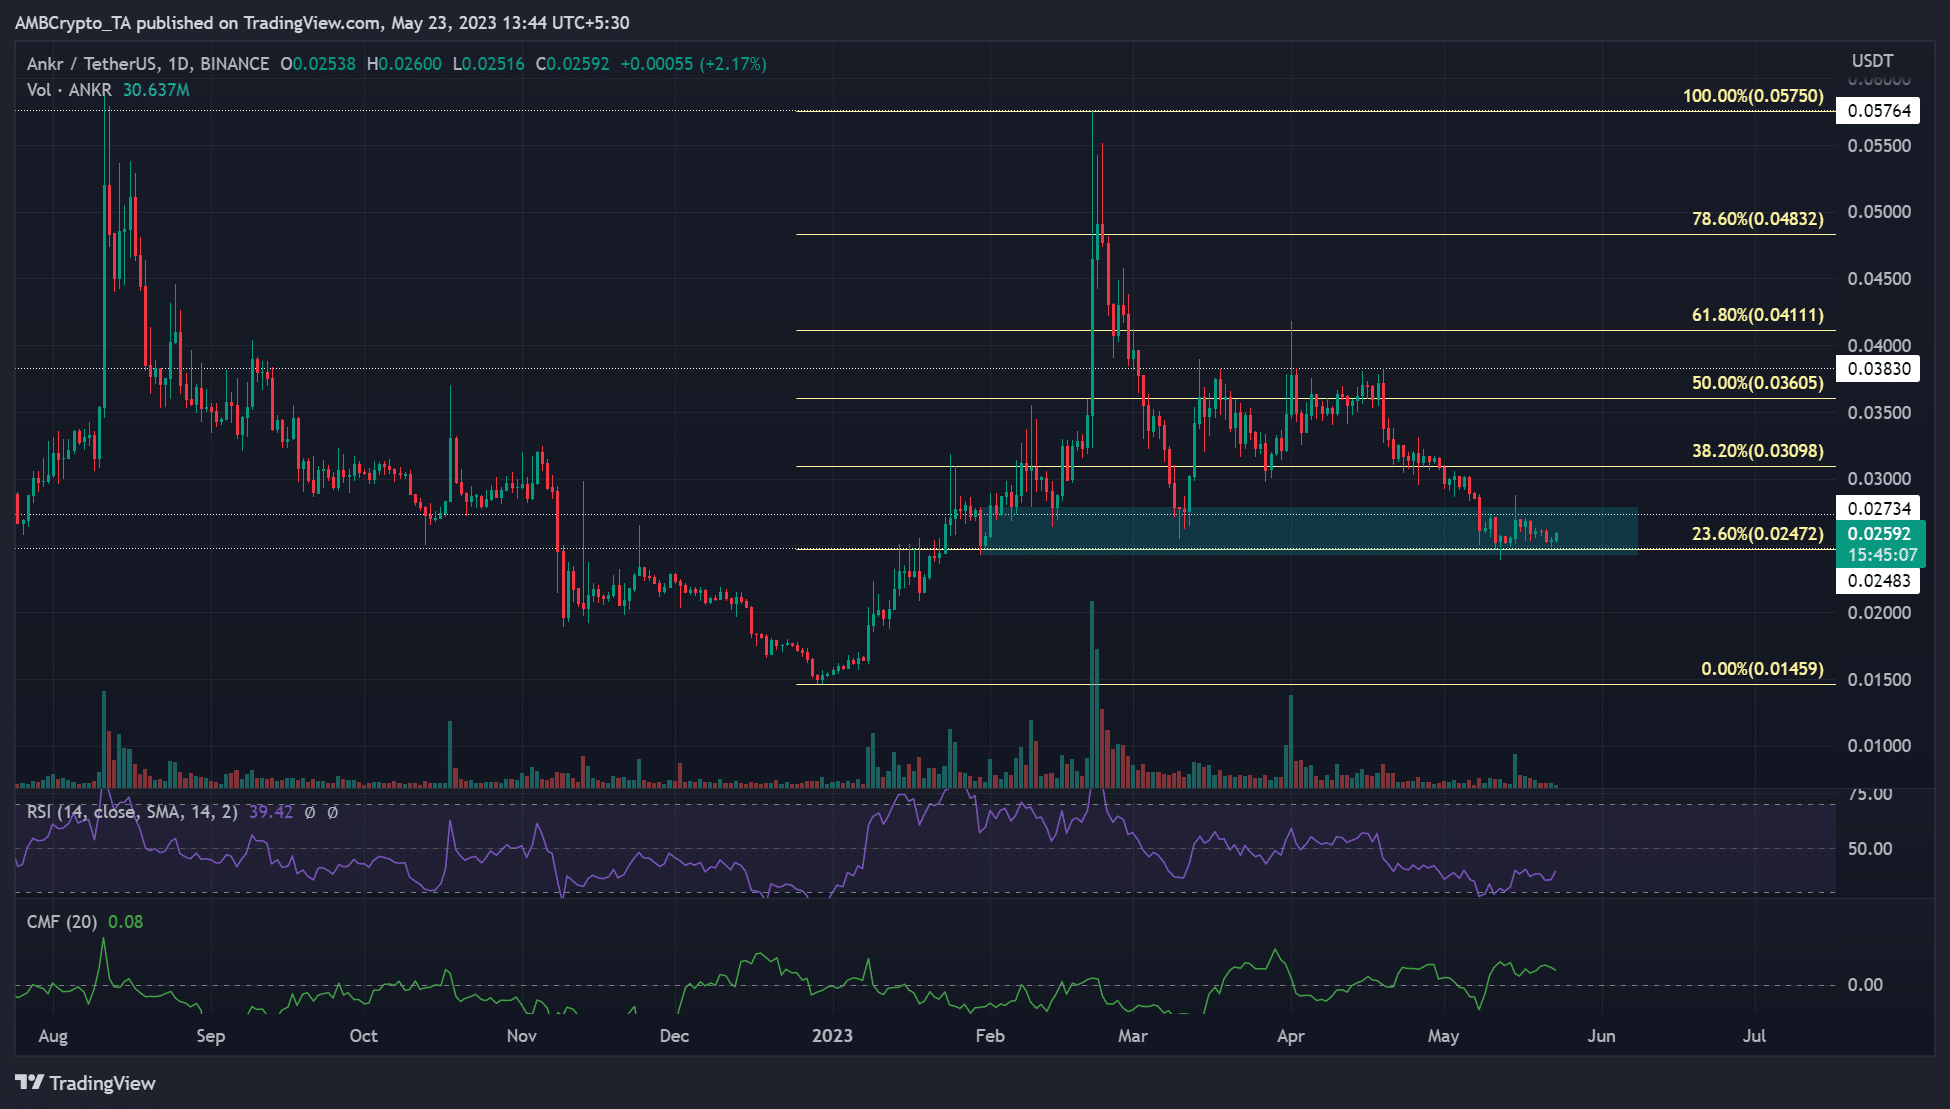
On the daily chart, ANKR recorded mixed performances in Q1 2023. Between January and late February, ANKR rallied by over 250%, rising from $0.01535 on 1 January to $0.05750 on 21 February. The upswing saw it retest its August 2022 levels. However, it wavered towards the end of Q1.
Extrapolated to its quarterly performance, ANKR gave over 120% gains to investors in Q1 2023. The plunge in late February/early March followed Bitcoin’s [BTC] drop from $25k to $20k over the same period.
So far in Q2 2023, the price has remained below $0.04000, with considerable price rejection seen at $0.03830. Overall, a huge chunk of value gained in Q1 2023 has been cleared.
ANKR’s price action plateaued around March lows of $0.02550. This level also lines up with a bullish order block (OB) and support zone of $0.02428 – $0.02788 (cyan).
Using the Fibonacci retracement tool, placed between December/January lows and Q1 highs, there are two key support levels to watch out for if sellers extend their gains in the next coming days/weeks.
The first support level that could offer refuge for bulls lay at $0.02000 – The November plunge following the FTX saga eased at this level. The second likely support is the December/January lows of $0.01500.
How much is 1,10,100 ANKRs worth today?
A retest of these supports could be feasible if sellers seek more gains and crack the prevailing support zone of 0.02428 – $0.02788 (cyan).
Conversely, ANKR could see recovery if the bulls continue to defend the current support zone. If BTC reclaims upper price zones, $28k and $29k, ANKR could rally from the March lows and retest $0.03830 or close above it.
However, the 38.2% ($0.03098) and 50% ($0.03605) Fib levels are key obstacles to consider for such a likely uptrend.
Meanwhile, the RSI (Relative Strength Index) has stayed below a neutral level since the second half of April – Highlighting limited demand for the tokens. However, CMF (Chaikin Money Flow) saw considerable fluctuations in the same period – Capital inflows wavered.
Now that Q1 saw exemplary gains while Q2 seems on the edge unless BTC reverses recent losses, what’s the current state of mid/long-term ANKR holders? Well, Santiment’s MVRV (Market Value to Realized Value) metric could offer some clues.
Long-term holders’ price performance
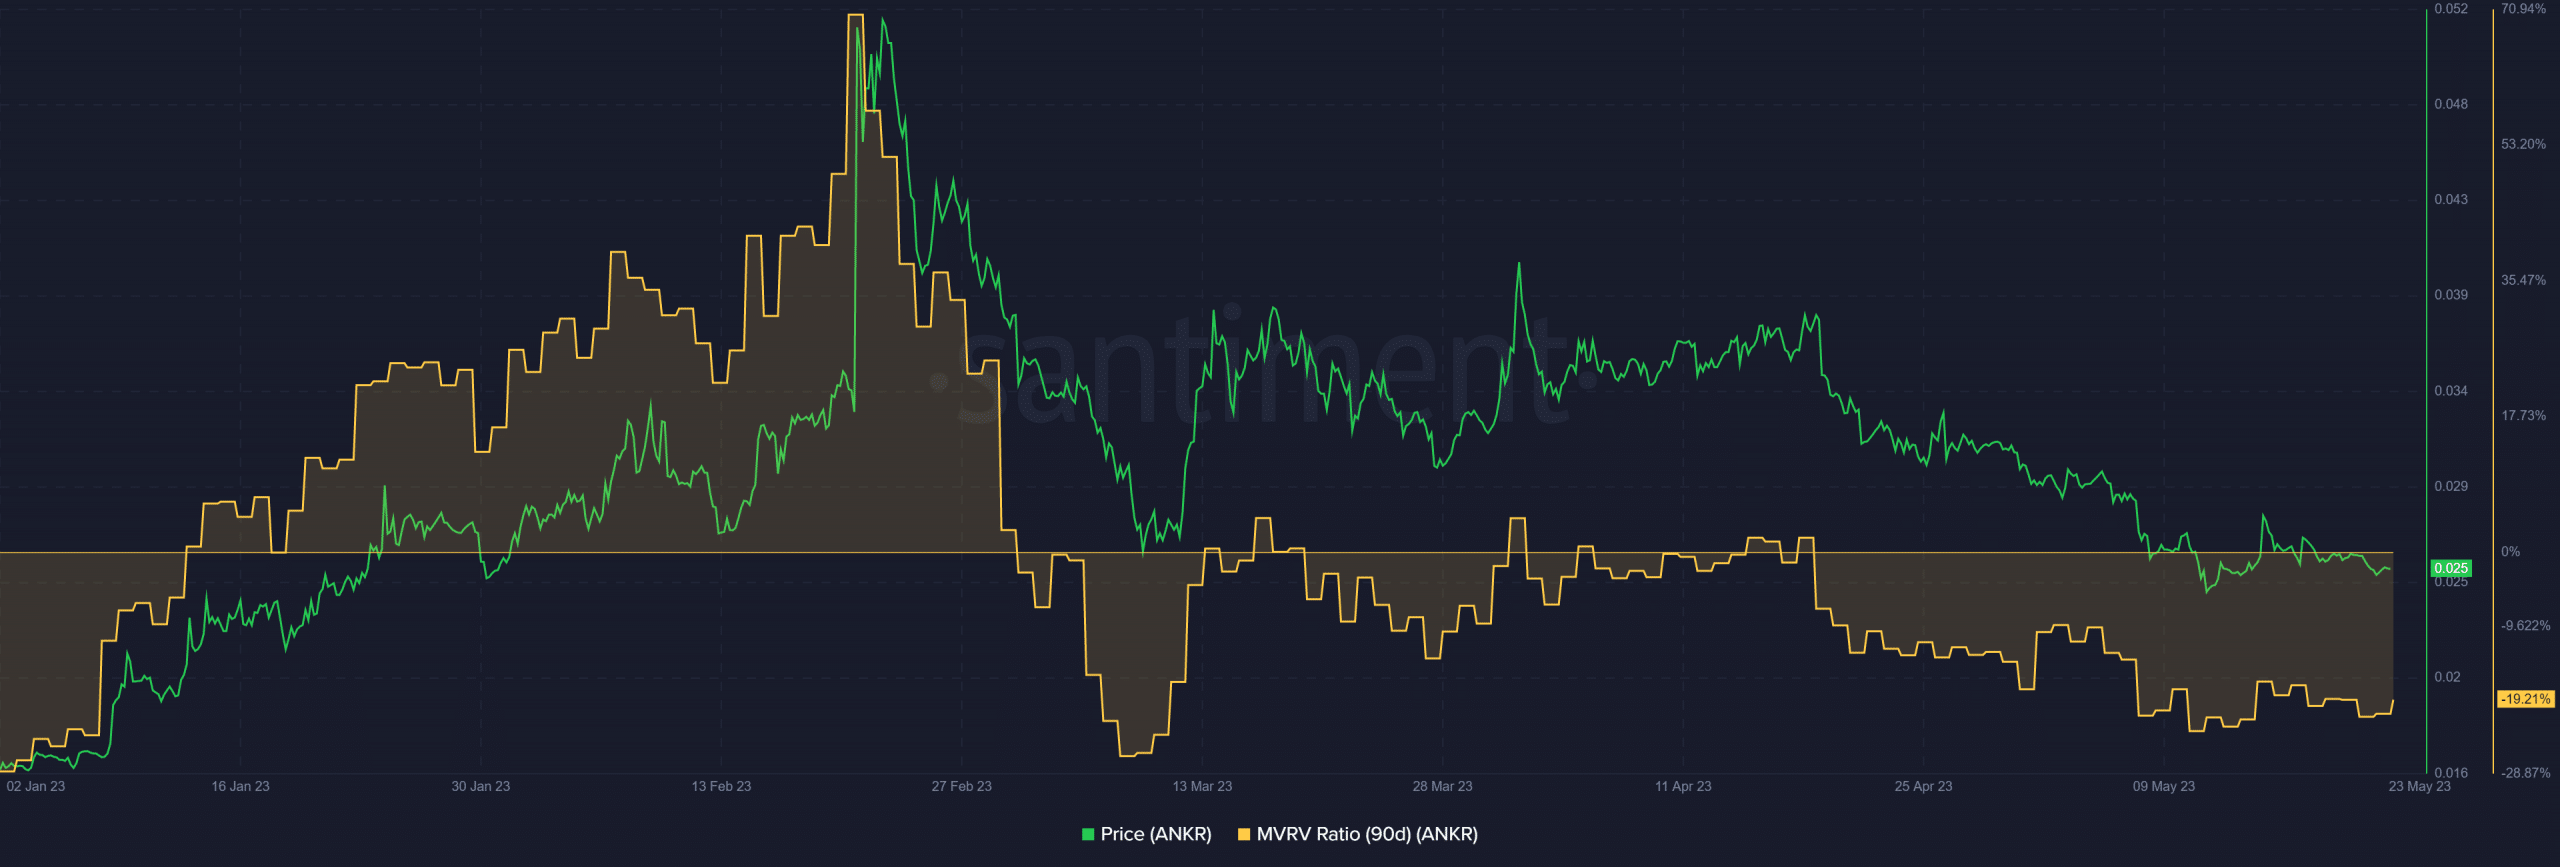
Some ANKR long-term holders took a market cut in late February. However, quarterly holders sustained about 19% losses as of press time, as shown by the negative 90-day MVRV.
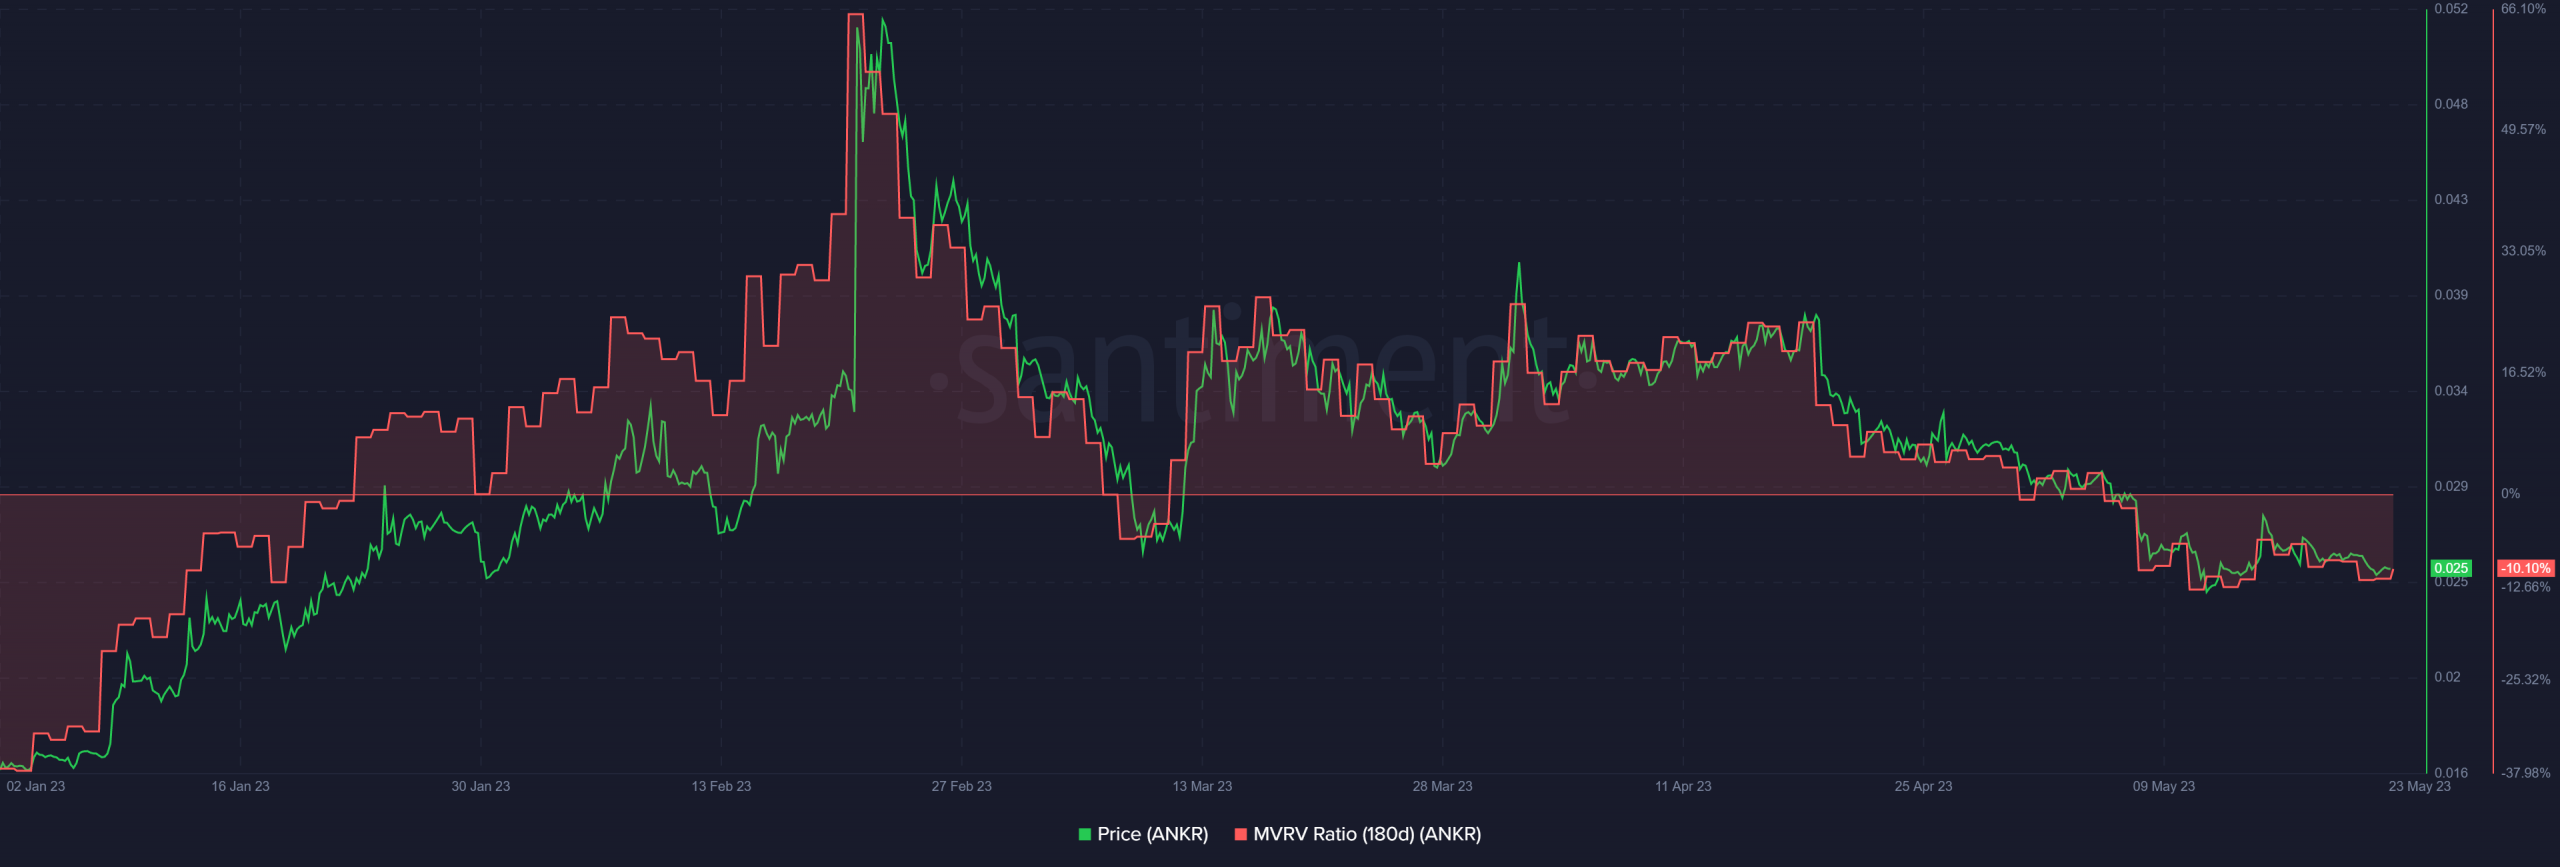
Similarly, bi-annual holders were at a loss, sustaining about -10% as shown by 180-day MVRV. This shows that bi-annual holders sustained fewer losses than quarterly holders.
Is your portfolio green? Check out the ANKR Profit Calculator
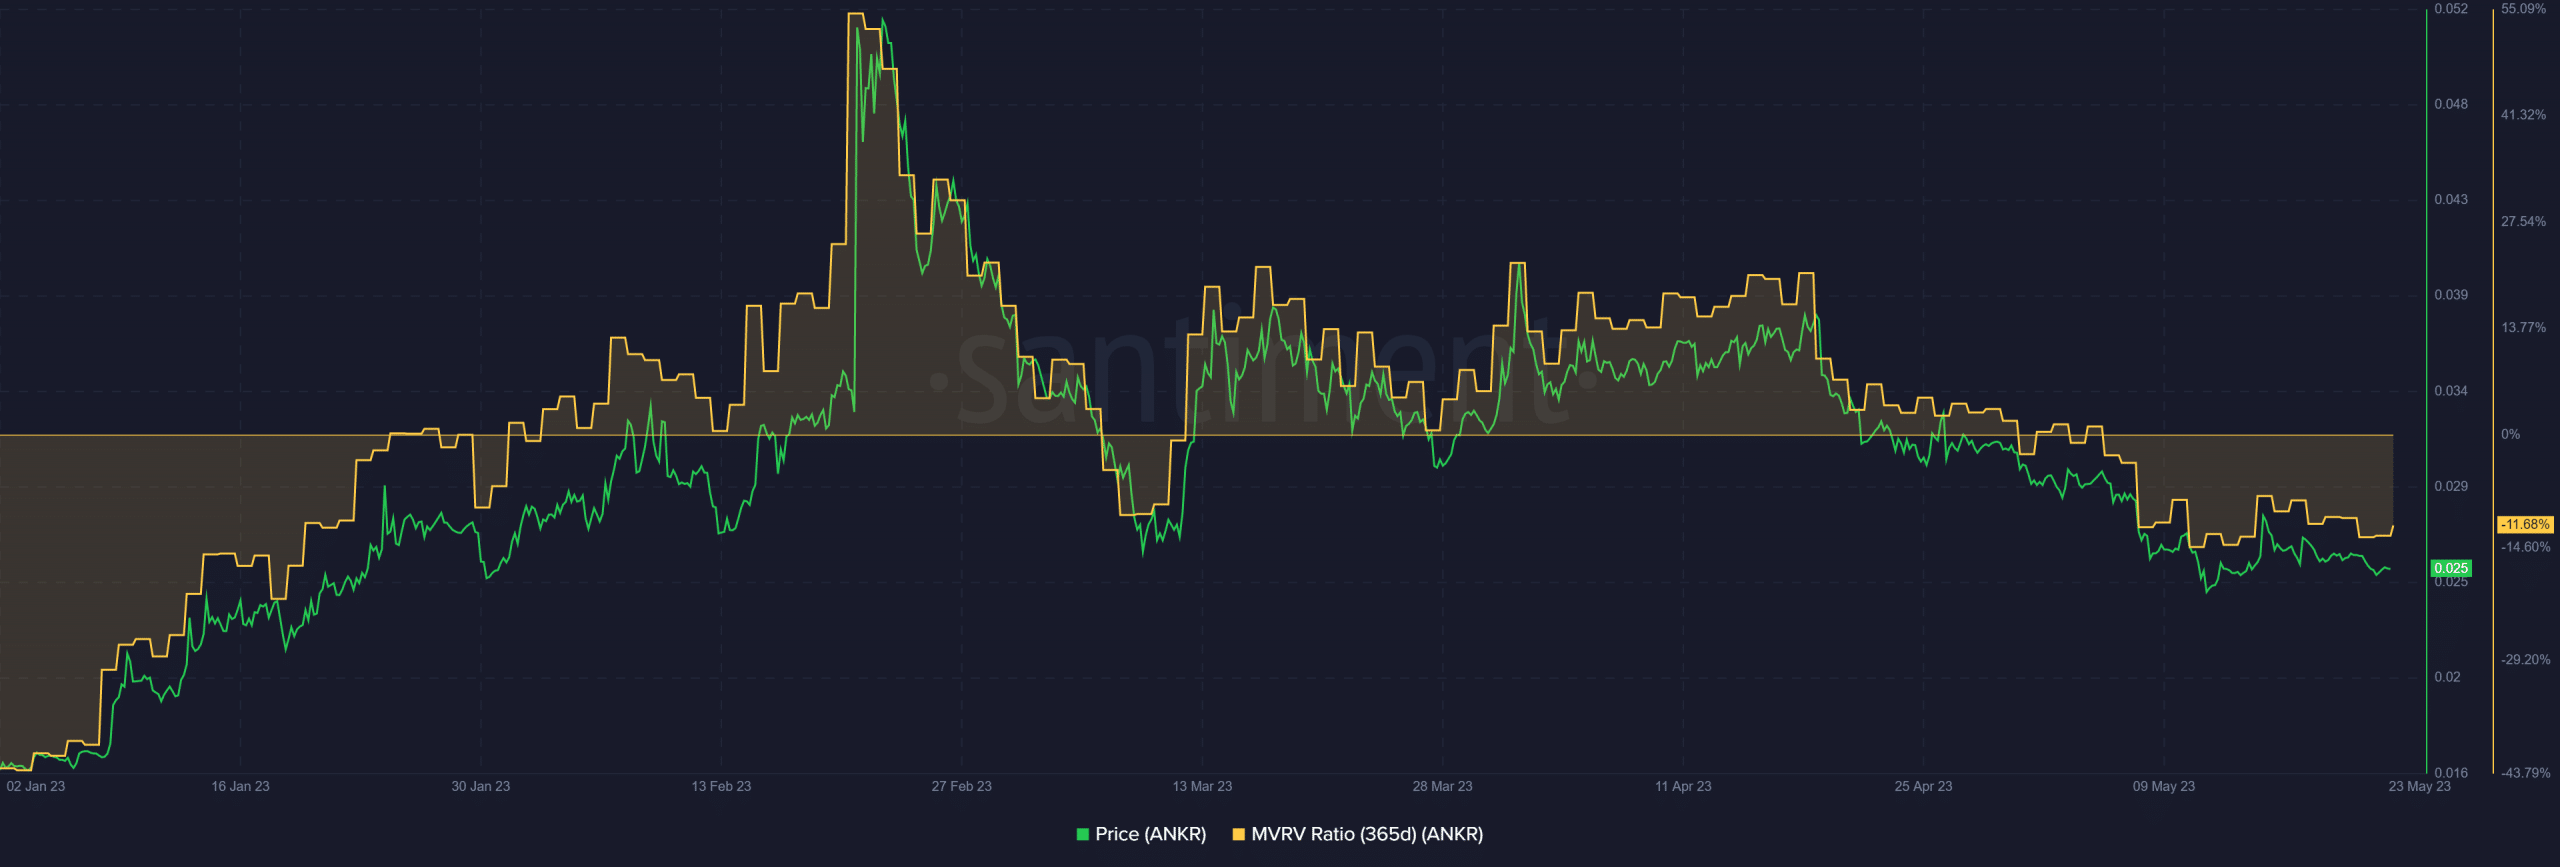
Annual holders followed bi-annual holders closely, posting about 11% losses as of press time. Put differently, the bi-annual holders’ category performed better than quarterly and annual holders as of press time.
Selling pressure abound
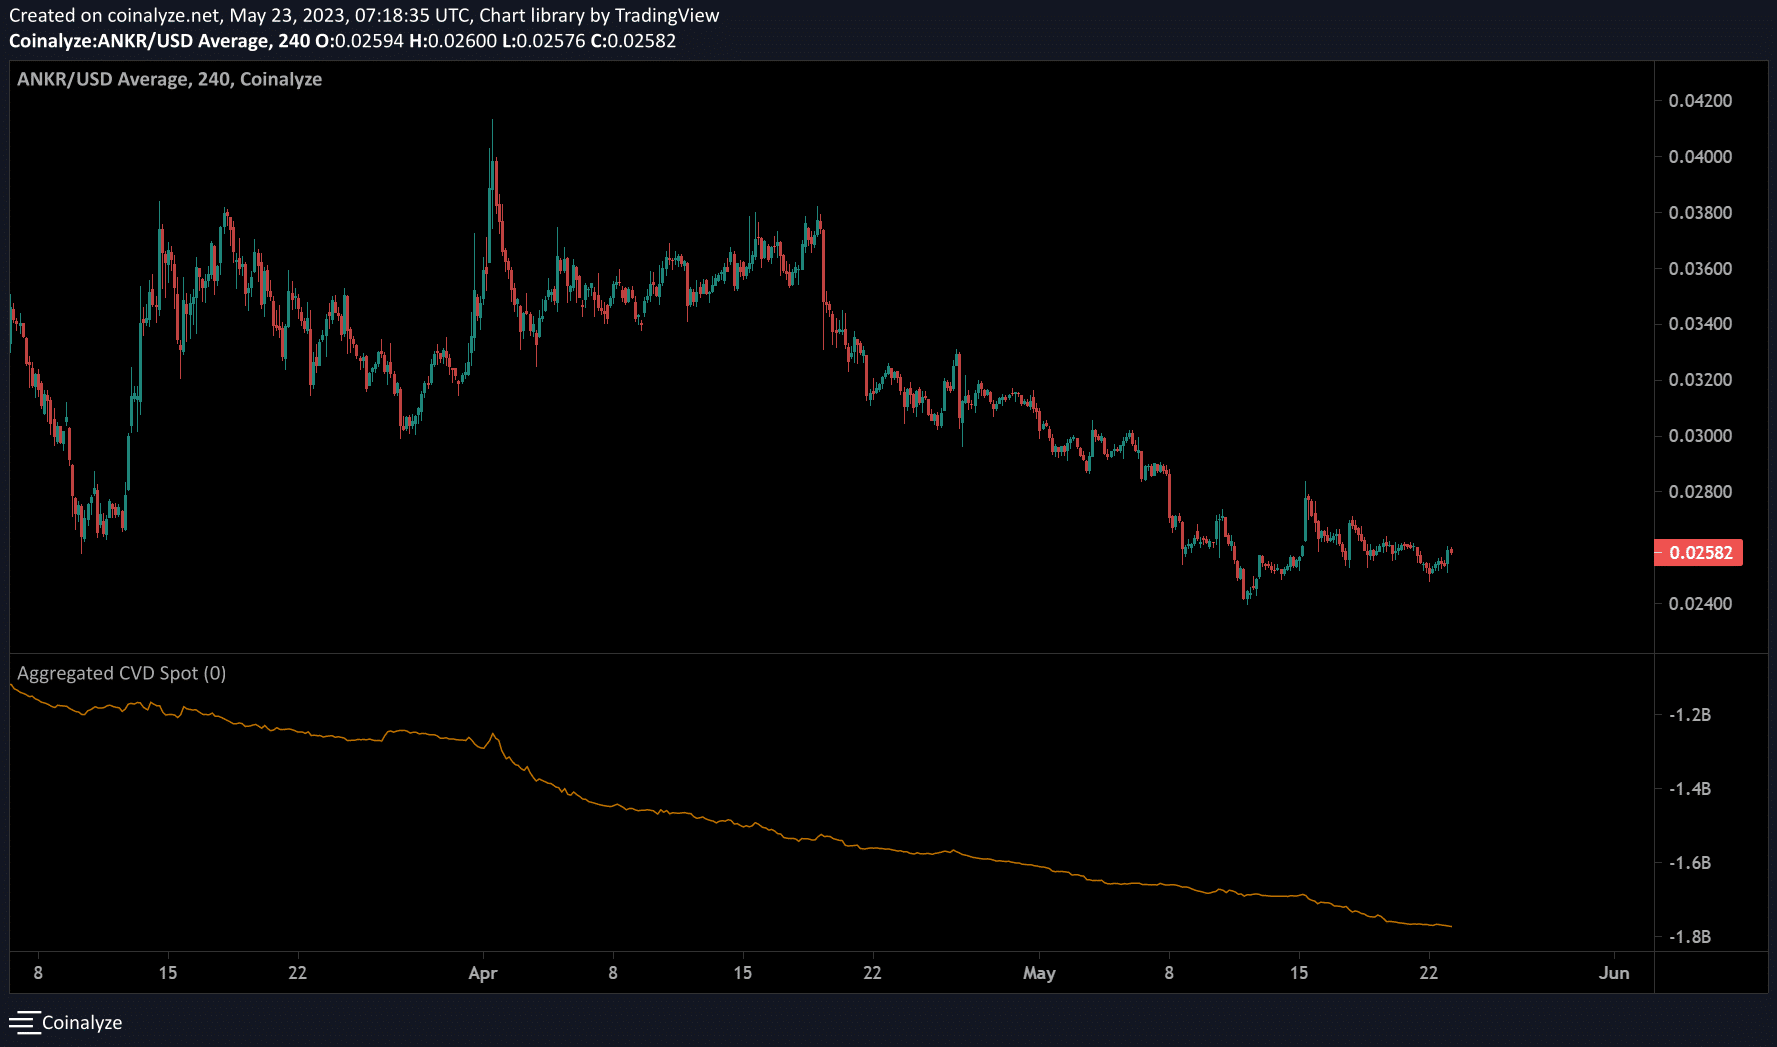
Nevertheless, each holder category must contend with prevailing short-term selling pressure. According to Coinalyze, the aggregated CVD (Cumulative Volume Delta) spot has tanked significantly since mid-April.
It reinforces a bearish sentiment as it shows sellers’ leverage, which could dent overall Q2 performance if the trend persists in the coming months.
Conclusion
Ankr’s massive partnerships across web3 and crypto-space saw its utility token, ANKR, post over 120% gains in Q1. The impressive performance was also marked by favorable macro-conditions.
However, macro-headwinds have intensified in Q2, with BTC fluctuations hammering ANKR’s price performance. If BTC’s whipsawing persists, ANKR could post more losses towards the end of Q2.
Nevertheless, bi-annual ANKR holders seem to be weathering the selling pressure better than quarterly and annual holders.

