ApeCoin [APE] traders willing to go short can make most of this pattern

Disclaimer: The findings of the following analysis are the sole opinions of the writer and should not be considered investment advice.
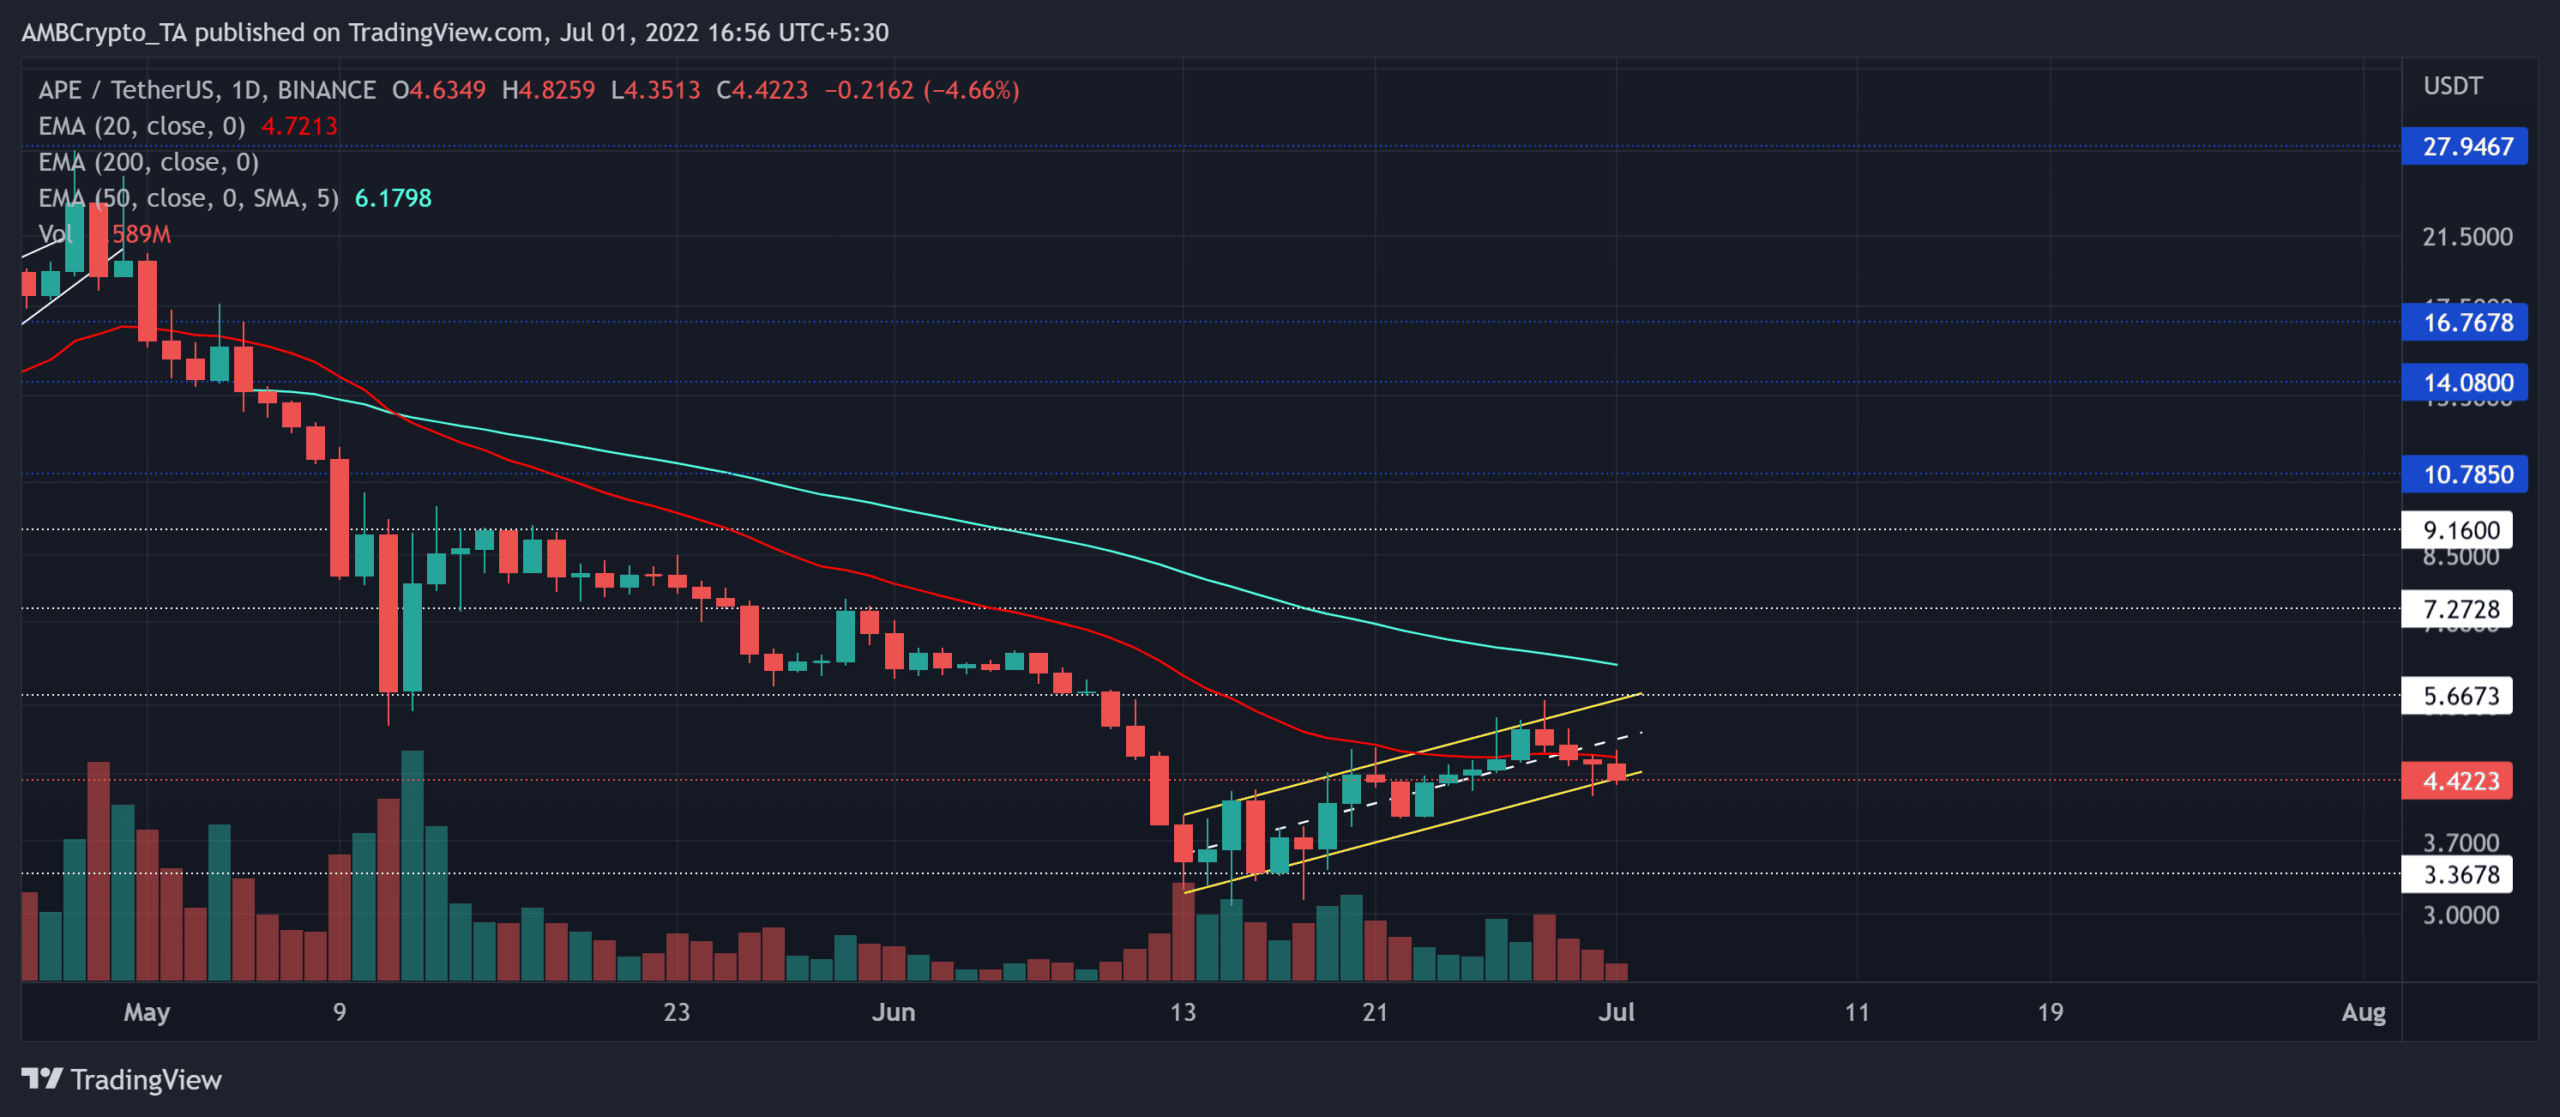
Since attaining its all-time high (ATH) on 28 April 2022, the ApeCoin [APE] selling spree has kept the alt below its daily 20 EMA (red) and the 50 EMA (cyan). The recent streak of higher troughs and peaks registered a decent recovery. But the bears continued to display a robust rejection of higher prices.
While a bearish flag setup flares up on the chart, sellers could extend the bearish phase in the coming sessions. At press time, APE traded at $4.4223, up by 4.12% in the last 24 hours.
APE Daily Chart
Since taking a U-turn from the $27.6-resistance, APE has consistently registered lower peaks over the last two months. After recording an 88% decline from its April highs, APE was down to find an all-time low of $3.0661 on 15 June. Post this, the alt marked a rather bouncy recovery on the chart.
For over two weeks now, APE saw a bearish flag and pole in the daily timeframe. With the 20 EMA constricting the buying efforts, a compelling close below the current pattern can expose the alt to downside risk.
To top it up, the volume trend was plunging during the formation of the flag pattern. This pattern generally performs well in such a declining volume trend.
A sustained close below the flag could aid the bearish efforts in retesting the $3.3-support. Post which, buyers would strive to refrain the sellers from finding fresher all-time lows. A continued pattern oscillation would likely see a reversal from the $5.6-zone.
Rationale
The Relative Strength Index (RSI) has been hovering around in the bearish zone for two months now. A break below the 42-level could aid the selling endeavors to retest the $3.3-level.
Further, the Chaikin Money Flow (CMF) blended with the bearish outlook. Investors/traders should watch out for a potential break above this level to detect any bearish invalidations.
Conclusion
Looking at the bearish flag and pole setup alongside the price action falling below the 20/50 EMA, APE could see a patterned breakdown. The targets would remain the same as above.
Finally, investors/traders should factor in broader market sentiment and on-chain developments to make a profitable move.


