ApeCoin forms a bearish pattern, can APE traders anticipate a 5% drop soon?

Disclaimer: The information presented does not constitute financial, investment, trading, or other types of advice and is solely the writer’s opinion.
ApeCoin [APE] experienced a bearish August. It reached a swing high of $7.8 in the first week of the month but has been unable to flip the $7.5 level to support. The bulls were left disappointed after APE took a turn to the south.
The altcoin posted losses of nearly 40% the past month and stood at a market cap of $1.5 billion. If Bitcoin [BTC] does not see some bullish respite, the pain could continue for APE investors. The formation of a lower timeframe bearish pattern also added weight to the probability of lower targets.
APE- 4-Hour Chart
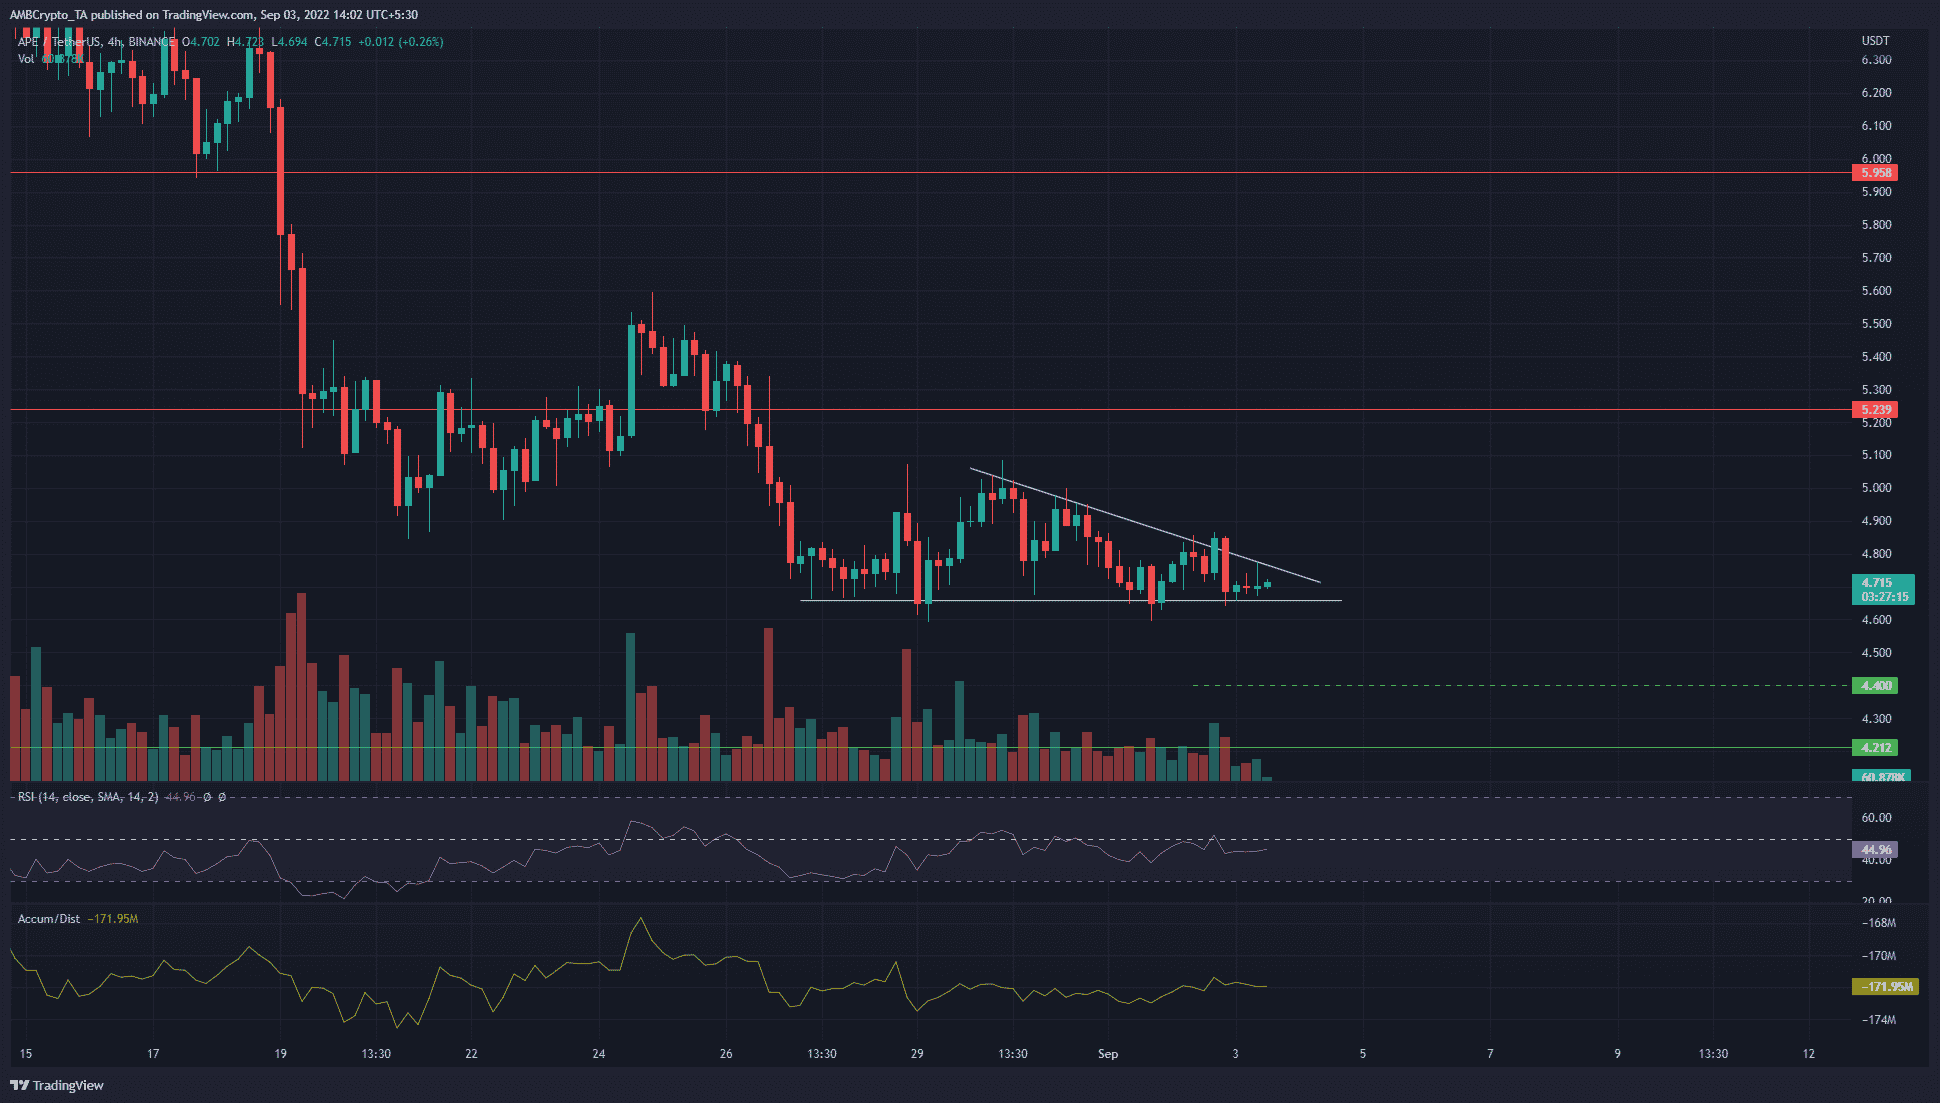
A descending triangle (white) was seen on the of APE/USDT pair price chart. This came after a few weeks of downward movement. The descending triangle pattern can see a breakout in either direction, but often follows the direction of the preceding trend.
In this case, the trend was bearish, so a move downward appeared more likely. However, a session close above $4.8 would invalidate the bearish notion.
The Relative Strength Index (RSI) has been unable to break past the neutral 50 mark on the four-hour chart, while the A/D indicator remained flat in the past couple of days. Therefore, the momentum was neutral and slightly bearish.
Market participants appear to straddle the fence and await a strong move for APE. The volume bars at the bottom of the chart have also declined, which meant many participants were sidelined.
APE- 1-hour Chart
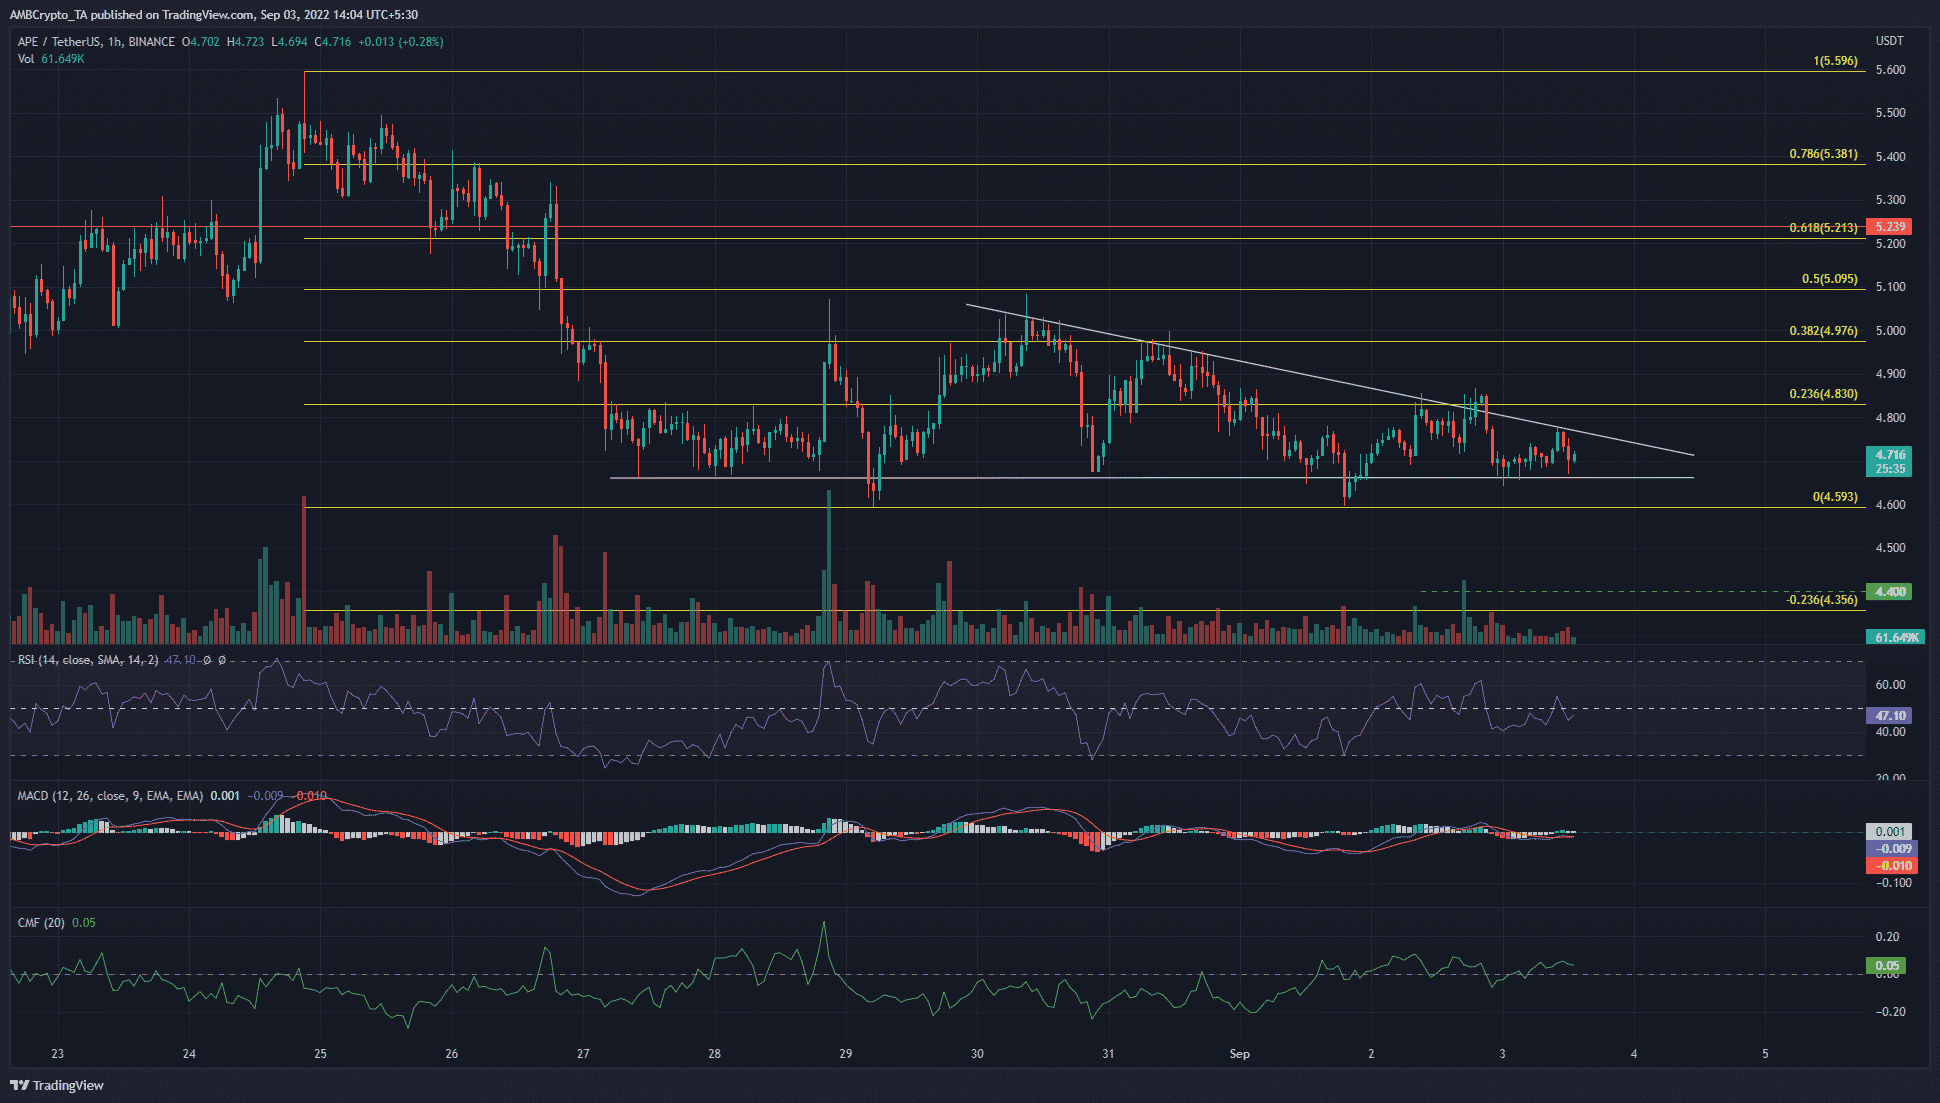
The descending triangle pattern presented a target of $4.4 for APE. Moreover, the $4.4-$4.35 area has been an area of support back in July. Hence, a breakdown beneath $4.67 could drop to find support in this zone.
A set of Fibonacci retracement lines (yellow) were drawn for APE. It was based on the swing high and swing low at $5.6 and $4.59. The 23.6% extension level lay at $4.35 and offered a confluence of support to the price at the $4.4 belt.
Conclusion
The formation of the descending triangle pattern combined with the downtrend of ApeCoin in recent weeks suggested that a 5% drop could materialize soon. An H4 session close beneath $4.67 can be used to enter a short position targeting $4.4. A stop-loss can be set in the $4.68-$4.7 vicinity. A move below $4.59 would add to the likelihood of further bearish pressure.


