ApeCoin Price Prediction – A reversal on the cards?
As APE continues to see more contraction on the price charts, this is how the odds stack up against long-term holders.

ApeCoin [APE] holders surged by about 20% in Q2 of 2023, compared to Q3/Q4 of 2022. However, the renewed interest hasn’t impacted the token’s price performance in Q2. So, an ApeCoin price prediction is necessary.
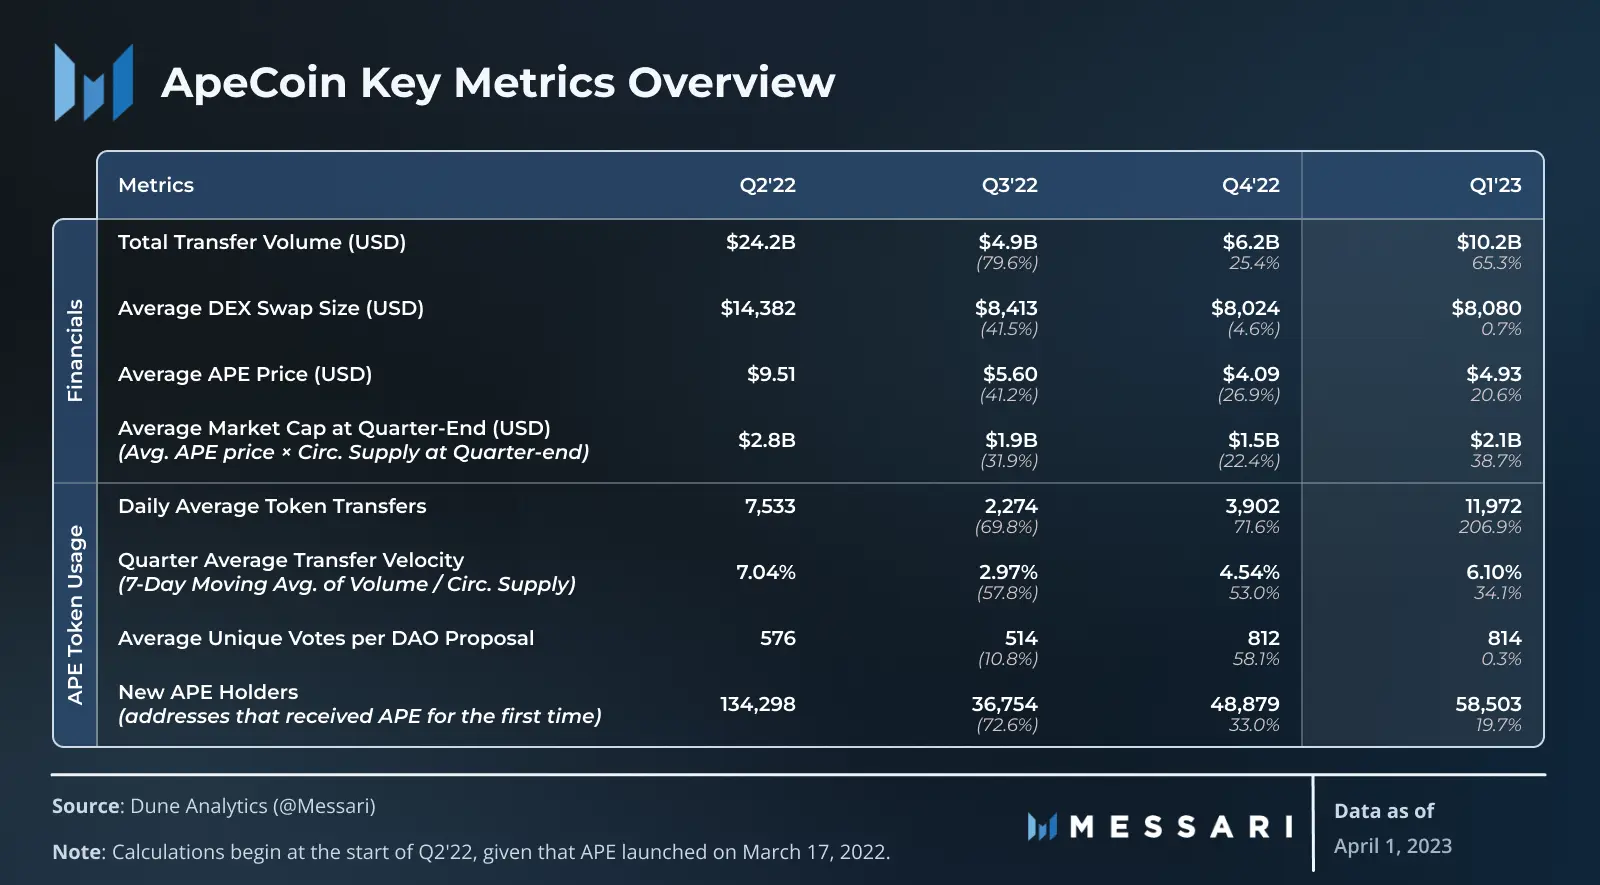
A previous Messari report on ApeCoin’s Q1 2023 noted that the token could see improved traction if it gets more utility beyond its DAO.
The report bets wholesomely on Otherside, another ambitious Yuga Labs venture that promises to use APE in future projects.
But, how have long-term holders fared in Q1, and what should they expect in Q2? Let’s explore the daily charts for some answers.
APE Price Prediction: Q1 vs. Q2 2023

At the peak of the January 2023 rally, APE posted over 75% gains, rising from $3.6 to $6.4. The $6.4-level was also a price ceiling in September 2022, with APE seeing a price rejection at this level.
Based on overall Q1 2023 price performance, APE rallied by about 17%, closing at $4.18 on 31 March after reversing most of January’s gains in February/March.
Since mid-March, price action has traded within a range, oscillating between $3.7 and $4.5. This further constrained positive price gains.
APE dropped below the range in early May after BTC lost hold of the $29k-level and fell below $28k and 27k, only to settle at $26k before attempting a rebound.
BTC’s plunge exerted more bearish pressure on APE into Q2 2023, pushing it closer to the post-FTX level and November lows of $2.8.
Additionally, overall price action is below a trendline resistance, confirming higher timeframe downtrend momentum and bearish bias. The same applied to lower timeframe charts at press time.
Based on the highest/recent swing high in April and the prevailing price level, APE has sustained a > 30% price dump. So far, this underscores the elevated bearish sentiment in Q2 (April/May).
If BTC falters further, APE could retest the November lows of $2.8 or dig lower. Already the price is below January levels, meaning all gains made in early 2023 have been cleared.
However, a recovery chance could be likely if bulls push APE above the trendline resistance and January lows of $3.6. A bullish BTC with a $28k+ value could tip APE to rally to $4.5.
Overall, APE’s price performance in Q1 2023 was impressive. However, it was derailed by February and March’s losses. On the other hand, Q2’s performance remains overly bearish unless BTC recovers $28k decisively.
With an overall contraction, it begs the question – What is the current state of short/long-term APE holders?
Short v. long-term APE holders’ performance

Is your portfolio green? Check out the APE Profit Calculator
As expected, the performance varies based on the MVRV (Market Value to Realized Value) ratio.
For starters, the 90-day MVRV or quarterly APE holders, were in 20% loss, while the bi-annual holders (180-day MVRV) posted a 23.5% loss at press time.
It suggests long-term holders are in more losses than short-term holders if they are to sell at current levels.

The aforementioned inclination is reinforced by the monthly holders (30-day MVRV) – They only suffered losses of about 8.6%, while others posted double-digit losses.

The MVRV Long/Short Difference, which tracks the difference between 365-day and 60-day MVRV, was negative too.
A negative value means short-term holders have little leverage over long-term holders. Especially as the latter will see more losses if they sell at its prevailing prices.

Short-term selling pressure abound
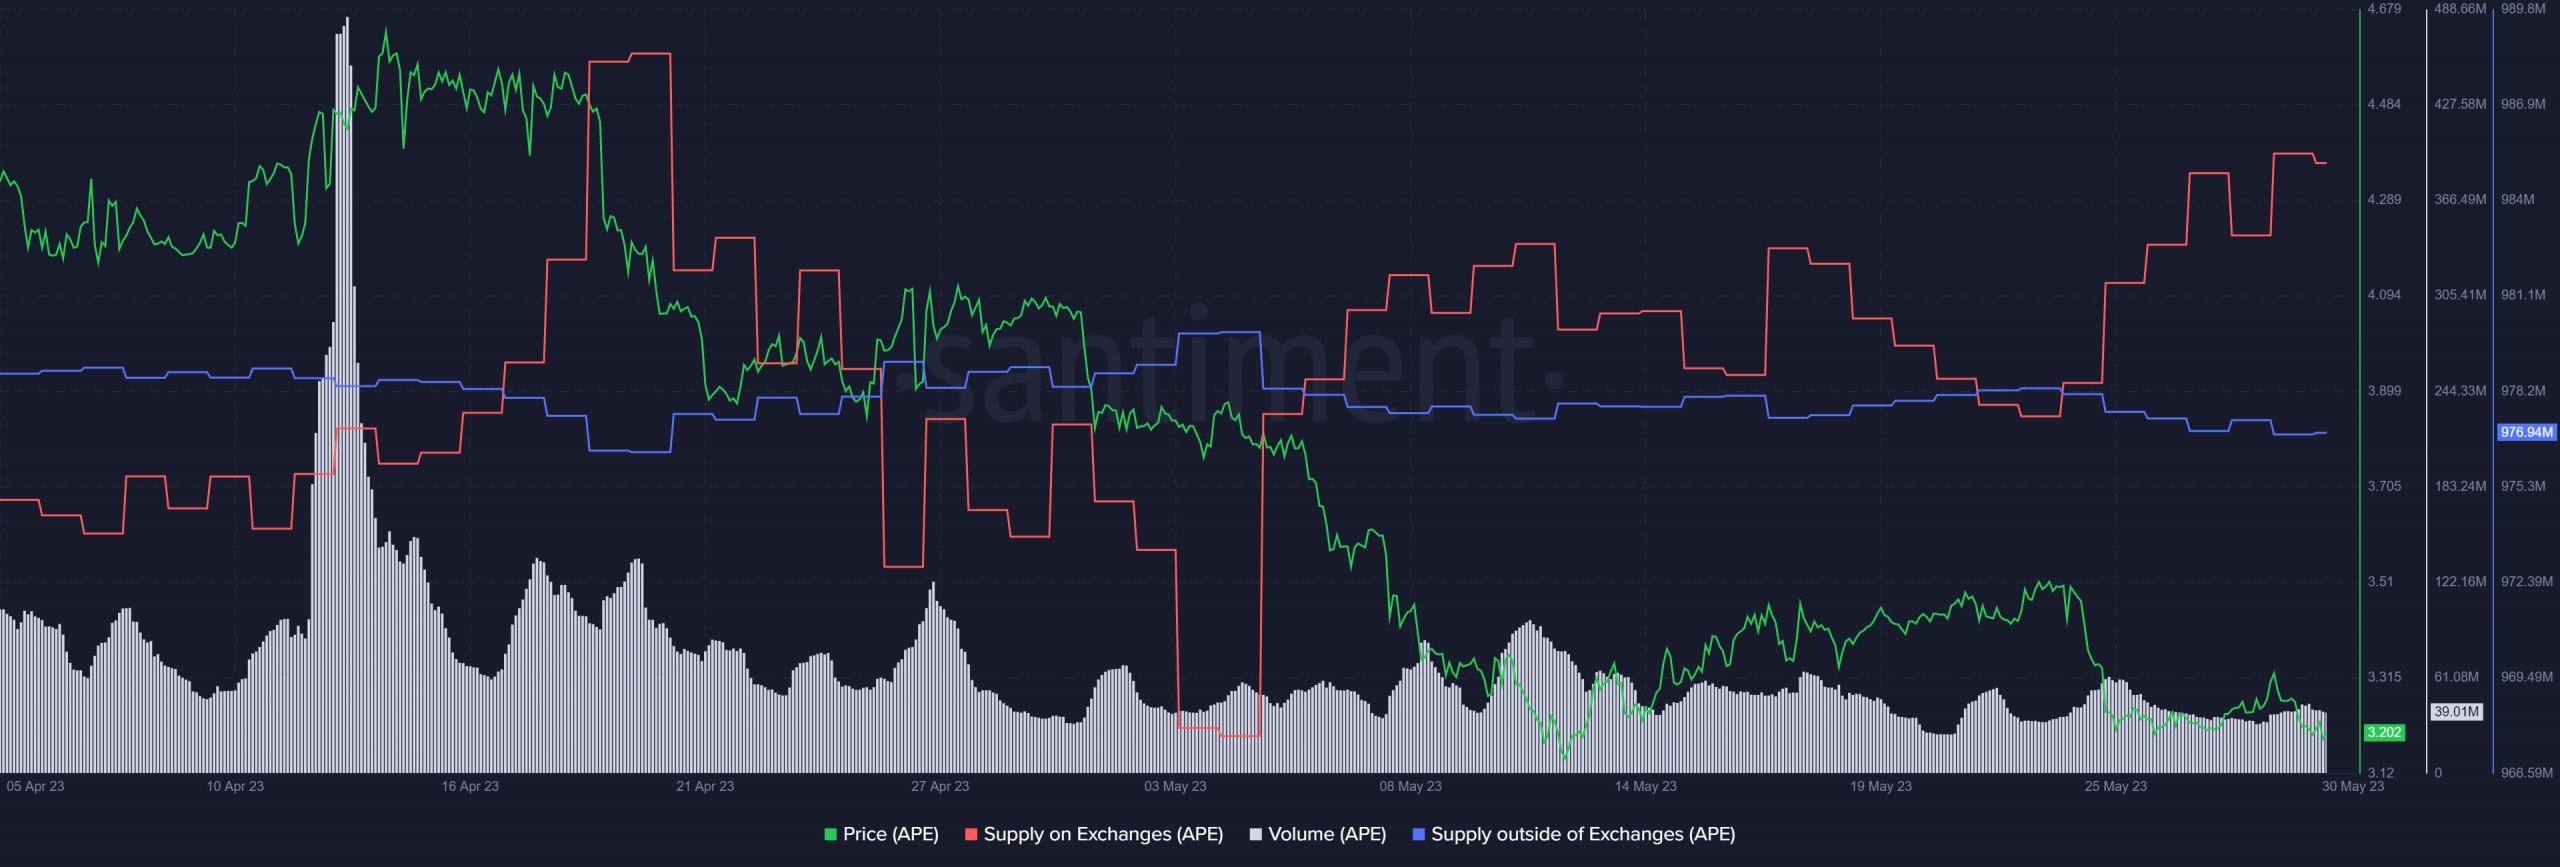
However, short-term holders aren’t entirely out of the woods yet. There is still rising short-term selling pressure, as shown by the spikes in supply on exchanges (red line).
Additionally, the trading volume dropped below $100 million in May, further complicating matters for bulls.
Even so, a bullish BTC could shore up the needed bullish momentum to help APE clear the trendline resistance roadblock and inflict a trend reversal. Hence, tracking this front is key before making moves.
Conclusion
APE’s downtrend reversal is feasible if BTC recovers $28k and surges. The southbound momentum has exposed APE’s price charts performance to more contraction since the end of January.
Although Q1 2023 offered substantive gains, Q2 is in a strong bearish grip and could only have a breather if BTC enforces an upswing into the $28k-zone.
However, long-term holders may avoid selling at its present prices because they’ll be exposed to more losses than short-term holders.


