Aptos [APT]: Bulls focus on key supply zone, but there are crucial hurdles ahead
![Aptos [APT]: Bulls focus on key supply zone, but there are crucial hurdles ahead](https://ambcrypto.com/wp-content/uploads/2023/02/brad-west-SHDCQ1l2WD0-unsplash-scaled-e1676542048549.jpg)
Disclaimer: The information presented does not constitute financial, investment, trading, or other types of advice and is solely the writer’s opinion
- APT was strongly bullish across higher and lower timeframe charts by press time.
- Bulls could target the supply zone at $20 if they clear key obstacles.
Aptos’ [APT] market structure has placed investors in a tricky position. The weekly chart formed a bullish flag that could offer extra gains. However, the daily chart faced crucial obstacles that must be cleared before investors could enjoy more profits.
Read Aptos’ [APT] Price Prediction 2023-24
The $20 supply zone: Is it reachable?
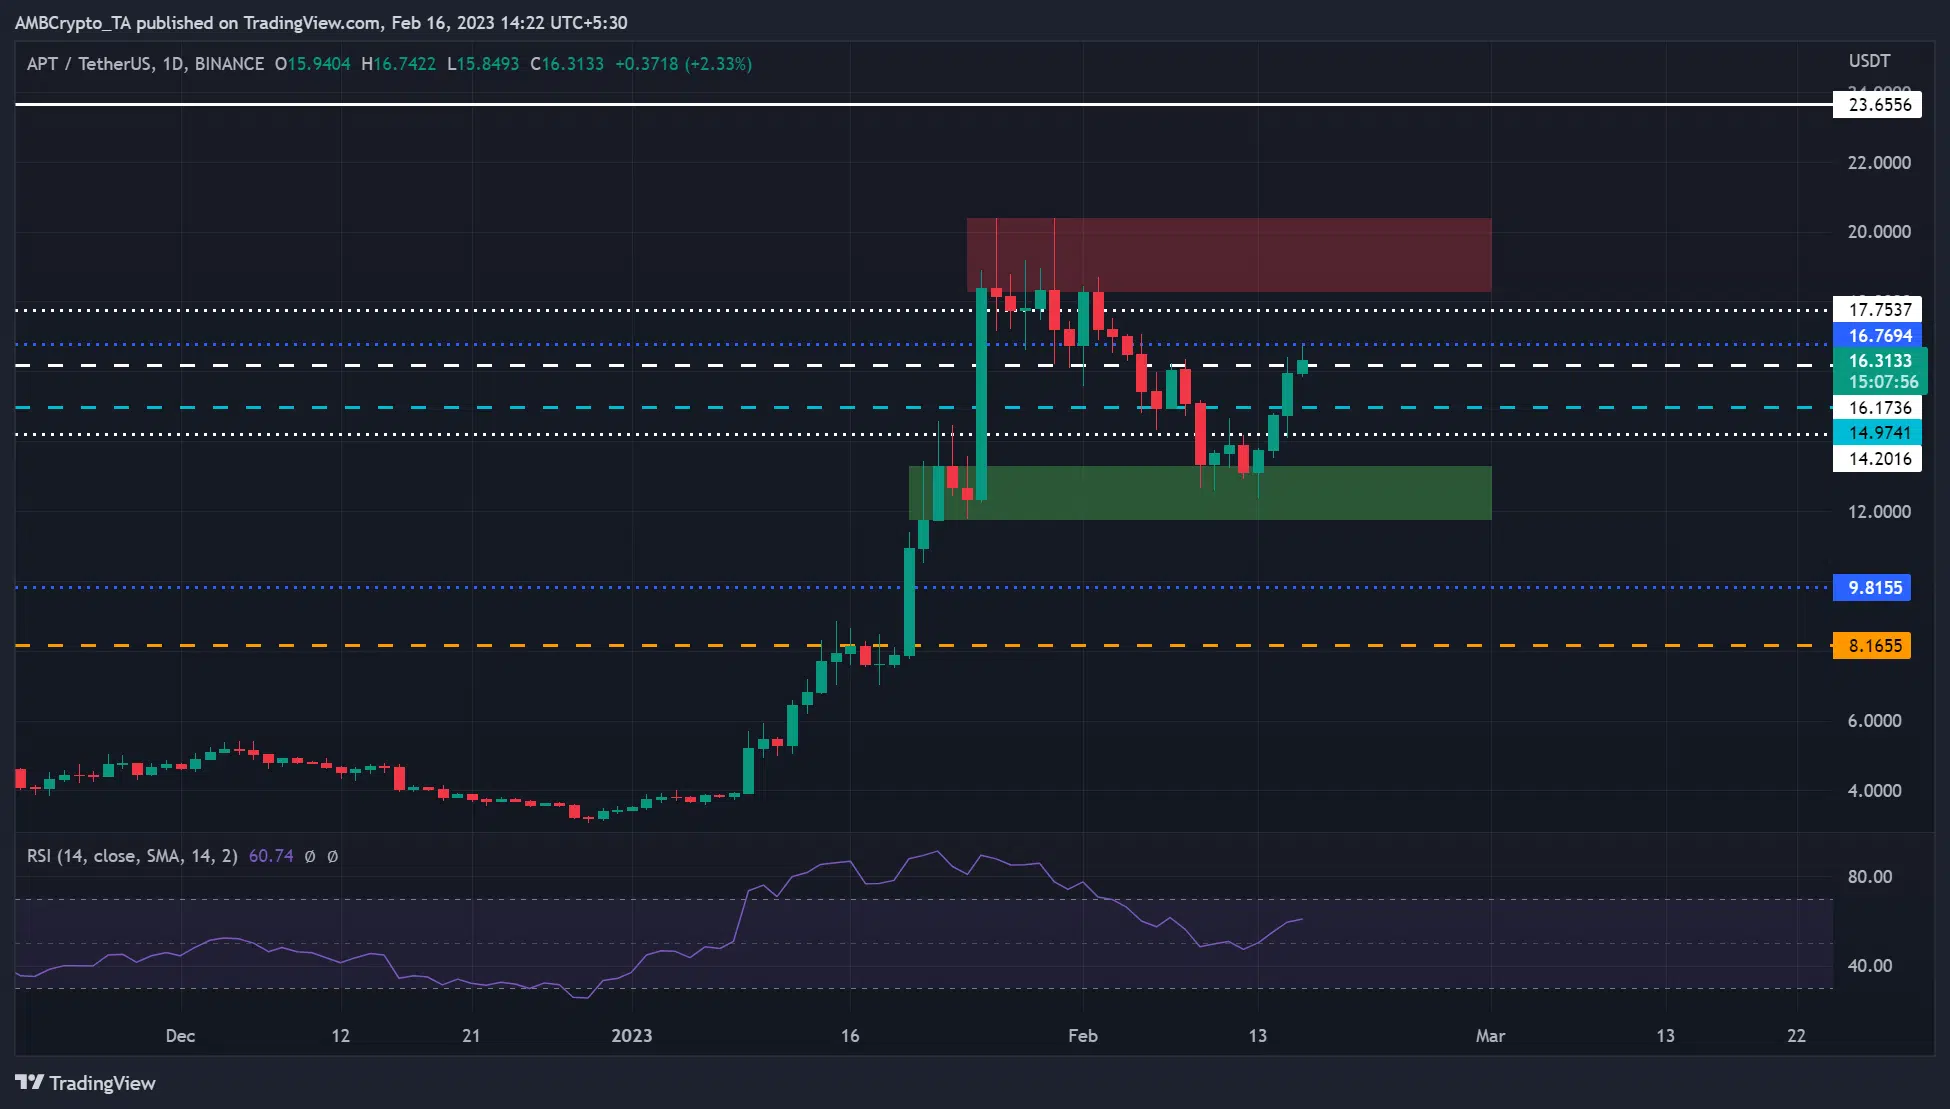
APT faced several price rejections in the $20 zone between mid-January and early February. The last price action in the zone ended up in a bearish order block that set APT into a correction. It plunged over 25% before hitting a critical demand zone (green).
As a result, the $20 zone became a critical sell pressure zone on the daily chart. Interestingly, APT’s market structure was bullish on weekly, daily, and lower timeframe charts at press time. Notably, it chalked a bullish flag on the weekly chart, indicating APT could hit $23.66 if bulls overcome the sell pressure zone. That would be another 25% hike in the next few weeks or months.
However, the bulls must clear the obstacles at $16.1736, $16.7694, and $17.7537 to reach the $20 supply zone. Weak hands could cash out at these levels, but diamond hands could aim at the $20 zone or $23.66.
The above bullish bias will be invalidated if APT breaks below the demand zone of $12.000. Bulls could place stop losses for long entry positions below $12.000. But such a downswing could aim at the bearish target of $8.1655. The downtrend could offer shorting opportunities at $9.8155.
How much are 1,10,100 APTs worth today?
APT’s Open Interest rate increased
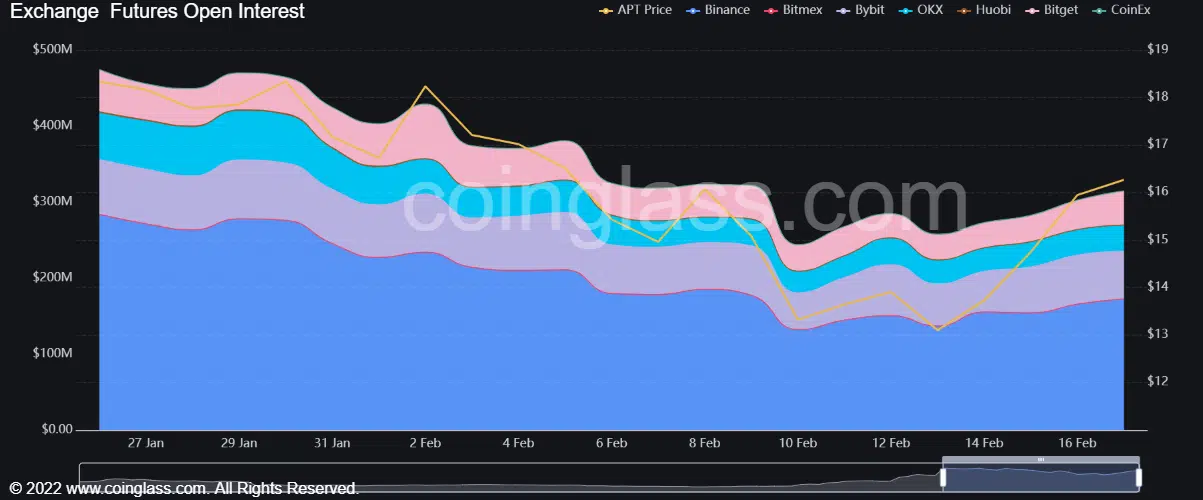
APT’s open interest rate (OI) declined gradually from the end of January, only to rebound on 13 February. The surge in OI on 13 February coincided with APT’s retest on the demand zone as a support, giving bulls the green light to launch a recovery.
The underlying bullish sentiment, as seen by the surge in OI, could boost APT to target the supply zone. However, a drop in OI could signal a drop in demand and bearish sentiment, which could derail bulls’ efforts to reach the $20 supply zone.


