Aptos [APT] is in price discovery, are you too late to the party?
![Aptos [APT] is in price discovery, are you too late to the party?](https://ambcrypto.com/wp-content/uploads/2023/01/PP-1-APT-cover-e1674714298808.jpg)
Disclaimer: The information presented does not constitute financial, investment, trading, or other types of advice and is solely the writer’s opinion.
- The higher timeframe charts showed overbought conditions but APT hasn’t slowed down yet.
- Short-term consolidation near $18 meant a retest could offer a buying opportunity, with Fibonacci extension levels to take profit at.
Bitcoin broke out of a bull flag near-term pattern. At the time of writing, it retested the $22.9k-$23k region and remains likely to proceed higher in the hours that follow. Aptos has hardly needed encouragement in recent weeks.
Is your portfolio green? Check the Aptos Profit Calculator
Despite overbought conditions, the price has gained more than 50% in under two days. This highlighted the strong bullish sentiment. Fading this rally could be especially risky- but was it wise to attempt to buy the asset now?
If you’re a bull, watch out for these short-term support levels
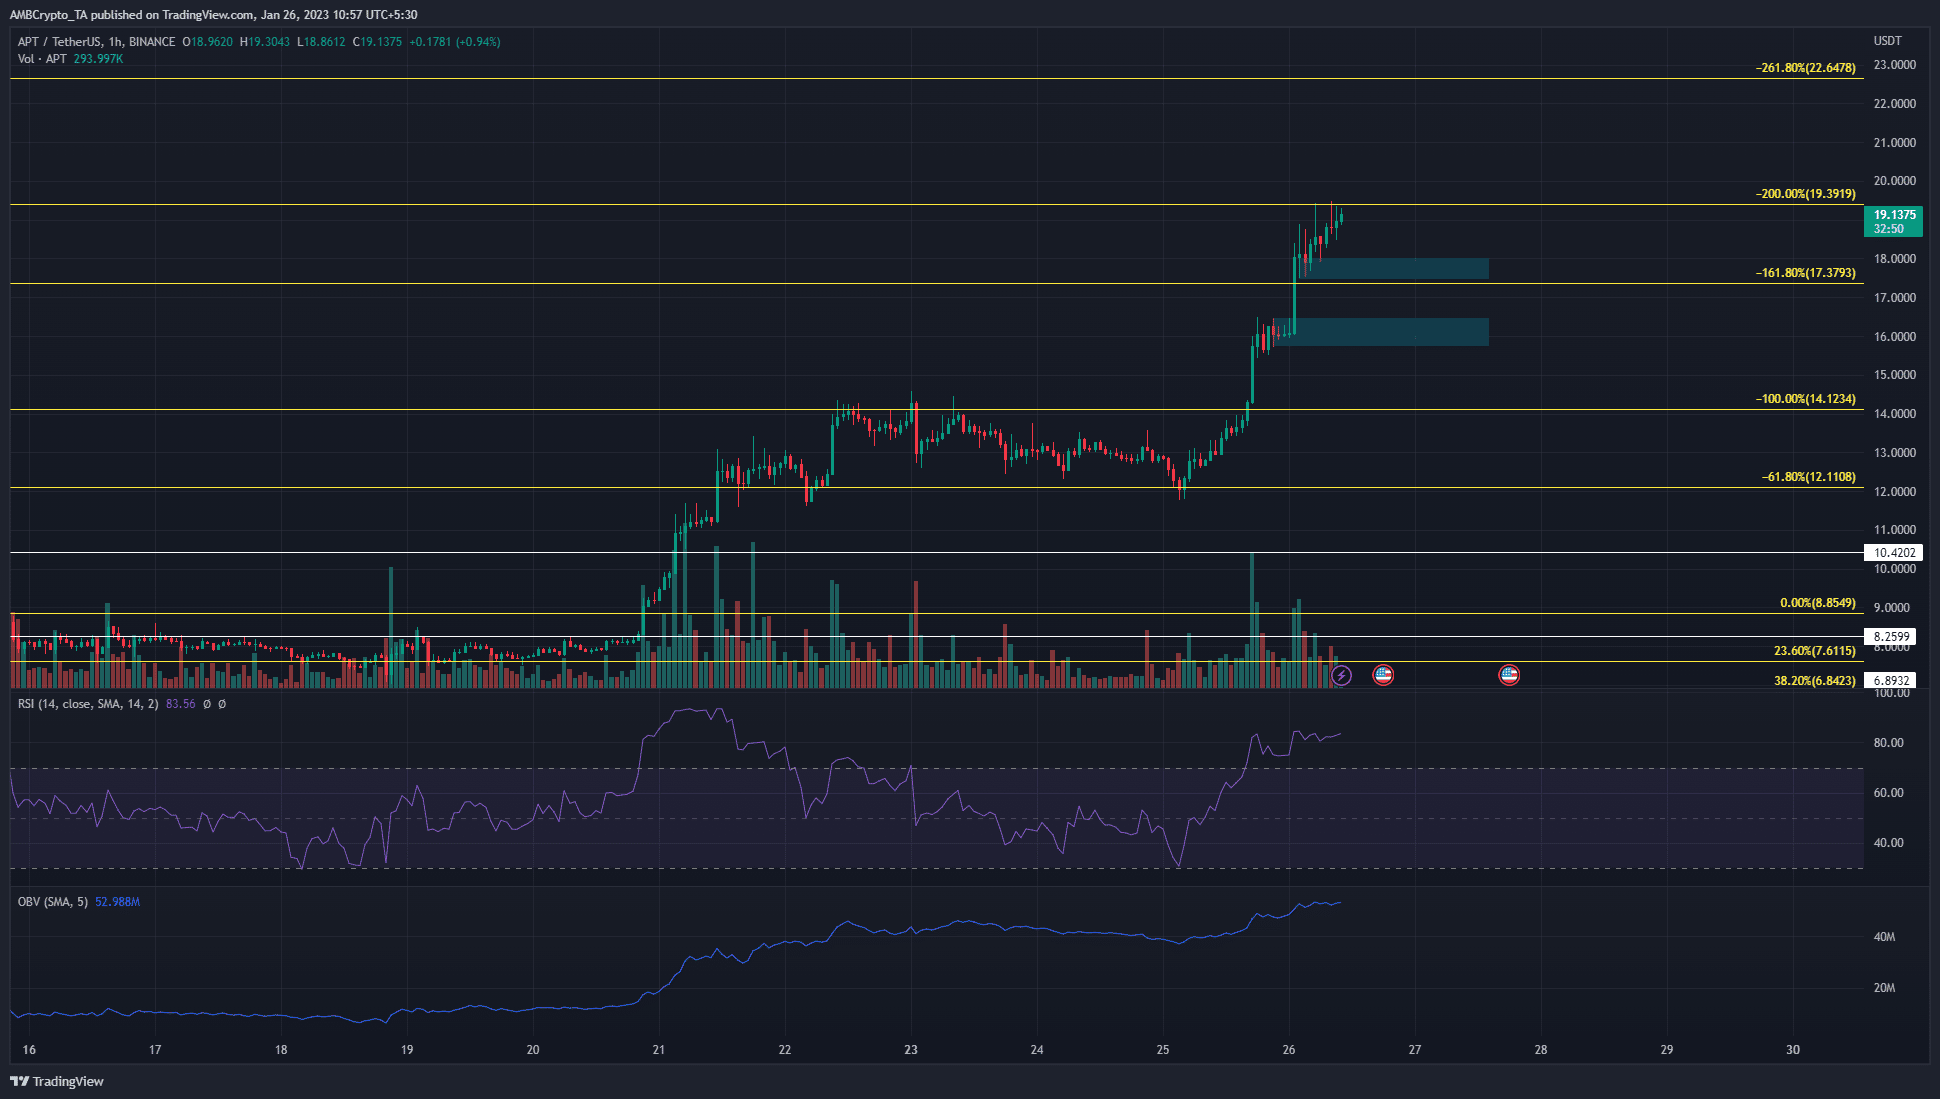
Bitcoin’s impending move upward was a factor that could sway APT to make further gains. A few days ago, Aptos consolidated in the $12-$14 region before exploding higher to reach $19. Similarly, traders can wait for another range to be established.
The near-term consolidation seen at $16 and $17.7, highlighted in cyan, could be a place to watch out for. A sharp bullish reaction from either of these levels could be a tell-tale sign of the bottom of a range.
Realistic or not, here’s APT’s market cap in BTC’s terms
It is also possible that APT can retrace beneath $16. If that happens, the $14.12 level could see bulls re-enter the market with strength. On the other hand, an extended move above $19.39 would be the more dangerous scenario. This could be fueled by short liquidations rather than demand, and trying to trade that move could be risky.
The 4-hour RSI was above the 70-mark to denote strong bullish momentum, and a bearish divergence has not formed on this timeframe yet. The OBV has also formed higher lows over the past 24 hours to show steady buying pressure.
Spot CVD has receded and Open Interest and funding rate mean volatility could ensue
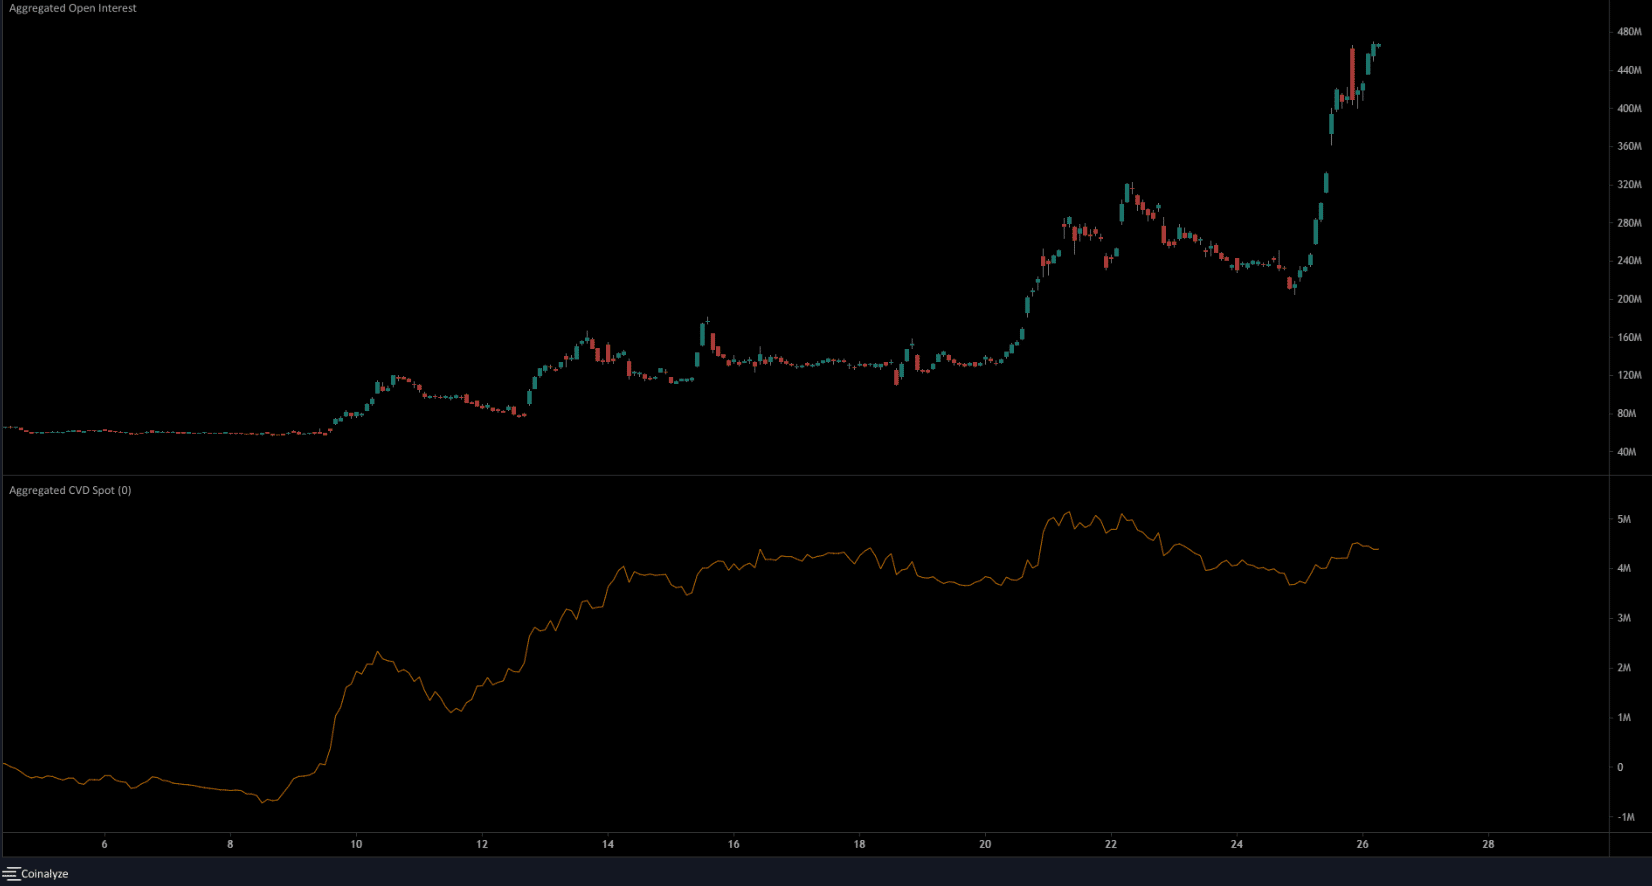
The Open Interest has increased enormously in the past three weeks. The spot CVD was also in a strong uptrend till January 21. Thereafter, the spot CVD tailed off to make a series of lower highs. Despite this, the OI continued to rise massively.
Coinglass data showed funding rate was extremely negative- a signal that many traders were trying to short APT. This could see a short squeeze, to force early short entries to puke their positions before a downward reversal. Such a short squeeze would be the riskiest scenario to try to trade.