Aptos drops 9% in 24 hours – Is $20 hard to cross?
APT crossed a key resistance at $14 but soon underwent a price correction.

- Aptos’ price dropped by more than 9% in the last 24 hours.
- A few metrics and indicators hinted at a trend reversal.
Aptos [APT] gained bullish momentum on the 16th of March as its value surged. The uptick allowed APT to go above a key resistance level, giving investors hope of APT touching $20.
However, the token couldn’t sustain the momentum and fell victim to a price correction.
Aptos’ bull rally ended
APT’s price managed to go up by 20% on the 26th of March. At that time, Aptos Insider, a popular X (formerly Twitter) handle, posted a tweet highlighting that APT managed to go above the $14 resistance level.
Since Aptos broke above the resistance, the next possible target was $20.
However, market dynamics changed, causing most cryptos’ prices to plummet, and APT was not untouched. According to CoinMarketCap, APT was down by more than 9% in the last 24 hours.
At the time of writing, APT was trading at $13.65 with a market capitalization of over $5.3 billion.
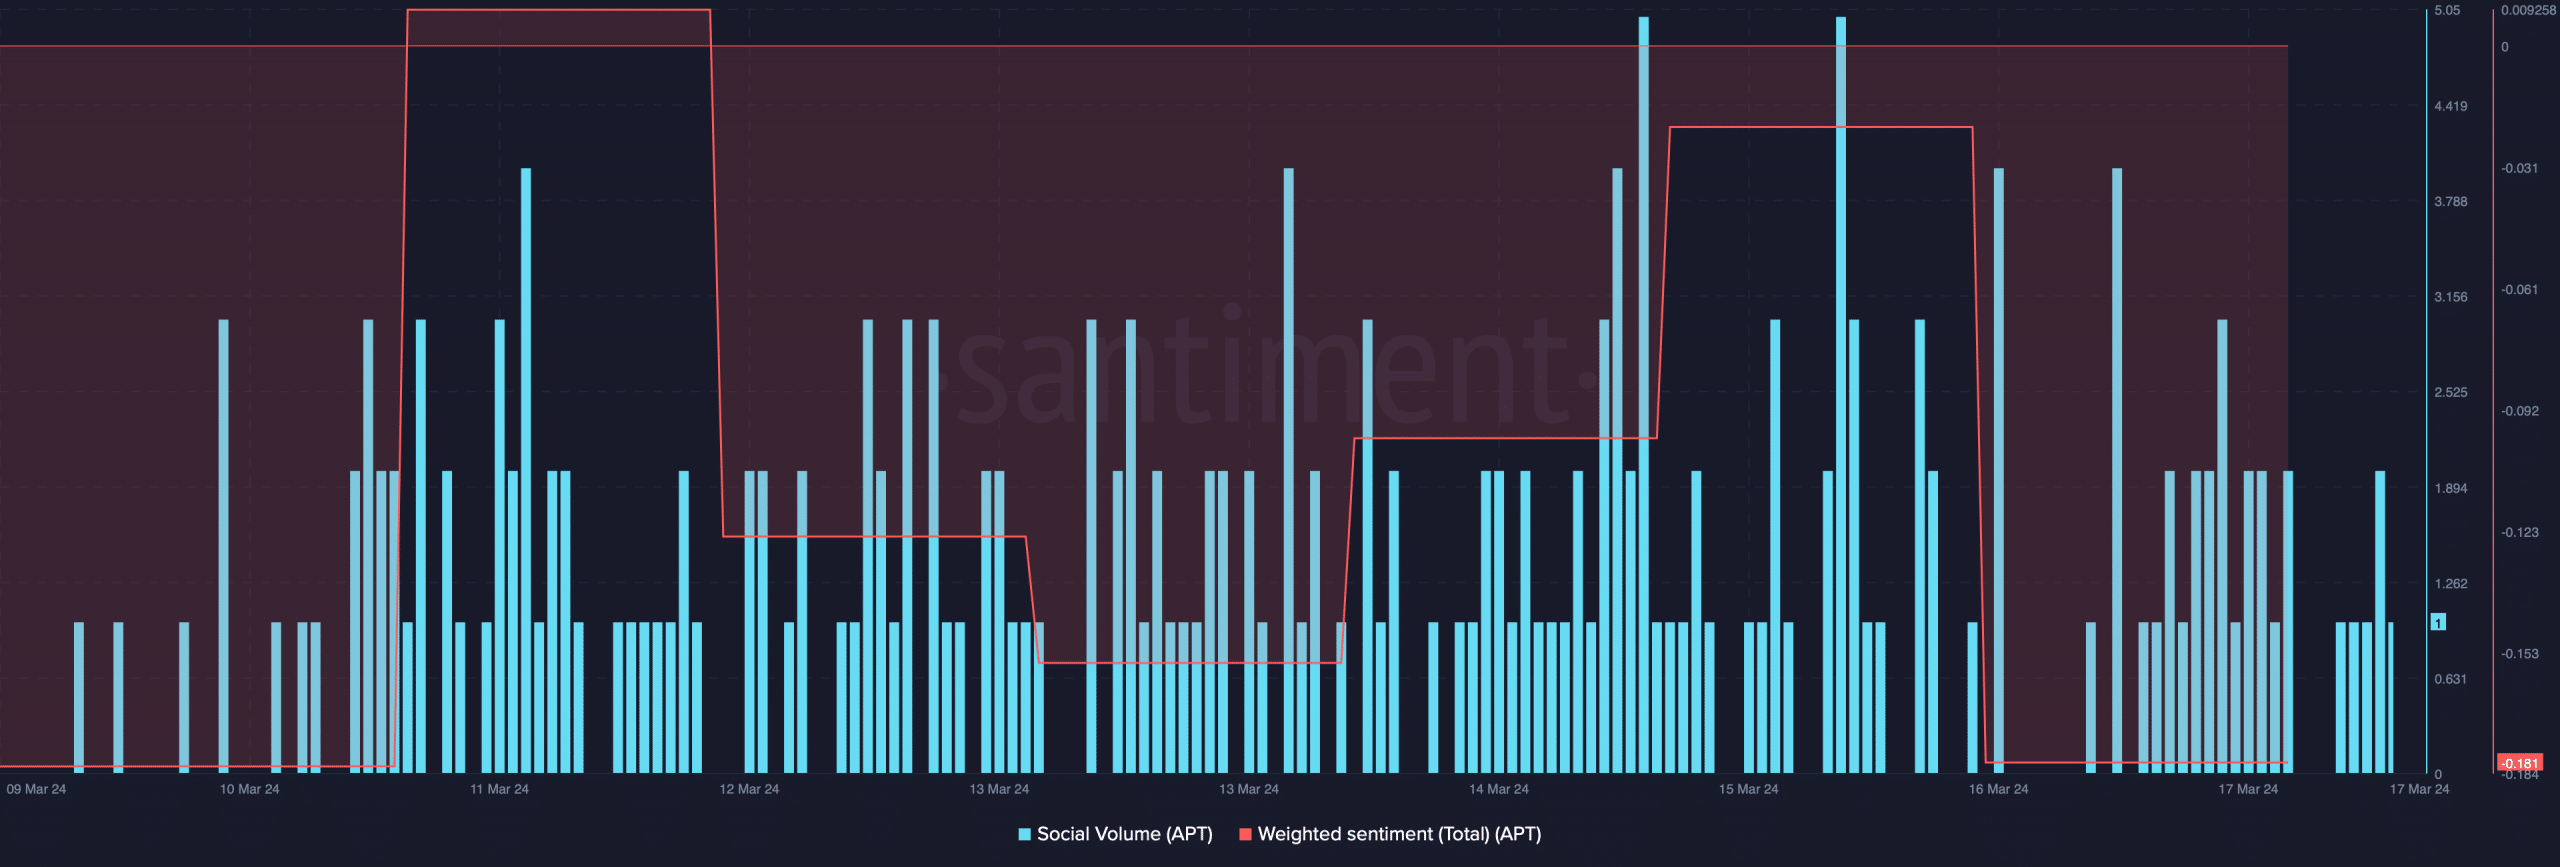
As volatility rose, APT remained a topic of discussion in the crypto space as its Social Volume remained high.
However, bearish sentiment around the token increased, which was evident from the massive dip in its Weighted Sentiment.
There are chances of a trend reversal
Though the price action and social metrics looked bearish at press time, a few other metrics hinted at a possible trend reversal.
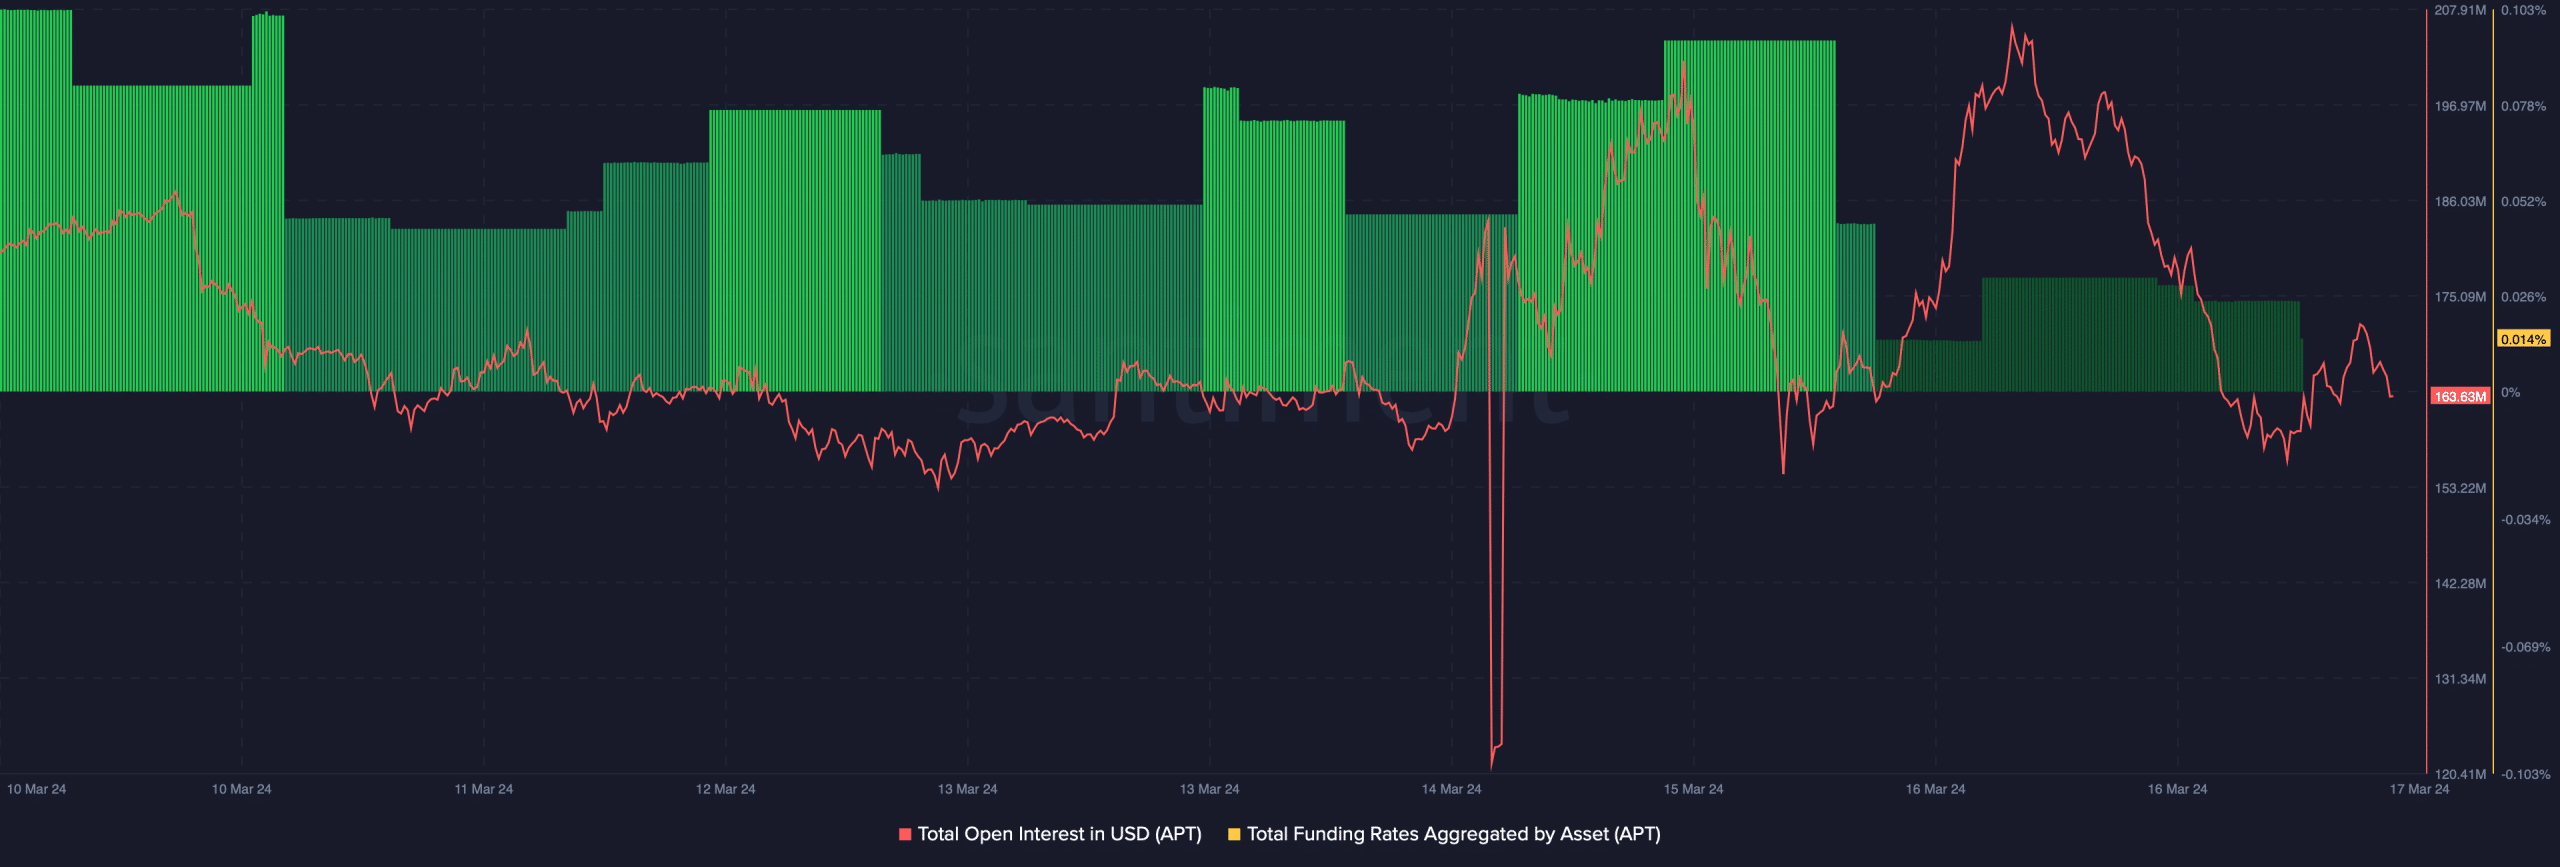
AMBCrypto’s analysis of Santiment’s data revealed that APT’s Open Interest dropped along with its price. A decline in the metric usually suggests that the chances of a trend reversal are high.
Additionally, APT’s Binance Funding Rate dropped. This meant that derivatives investors were not buying the token at the lower price, indicating a further price uptick.
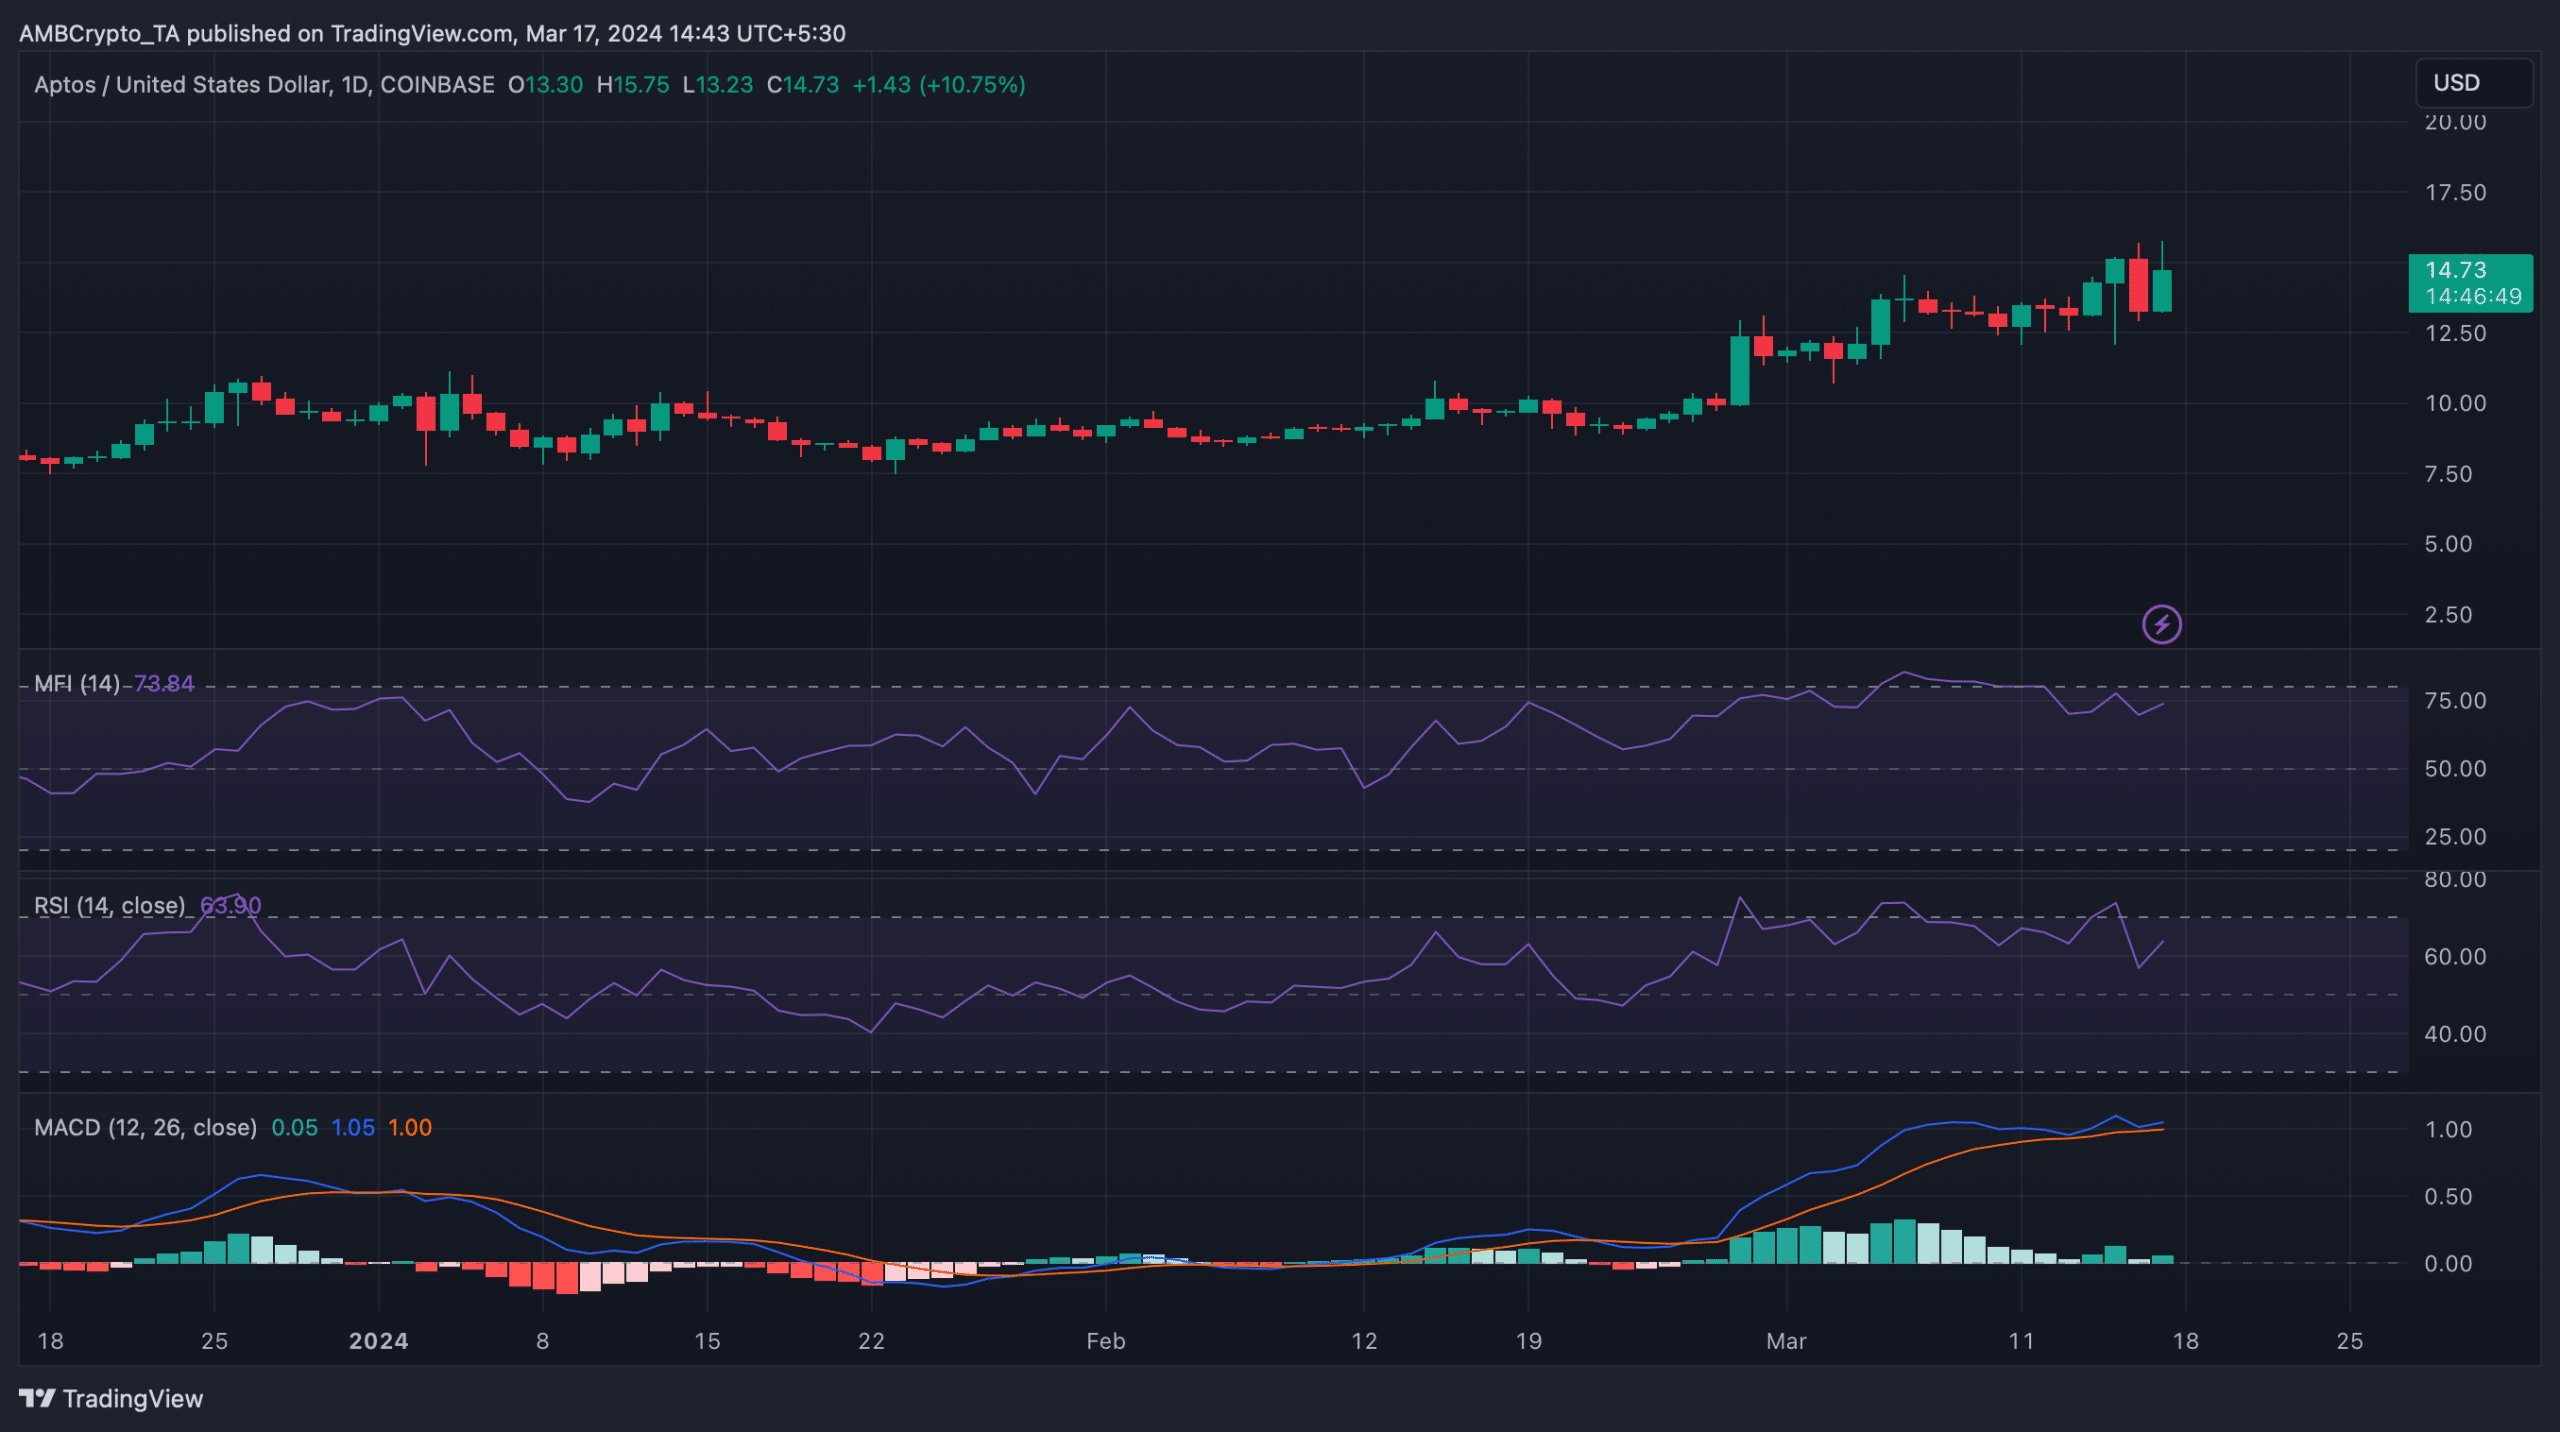
To get a better understanding of whether a trend reversal is possible, AMBCrypto checked APT’s daily chart. Our analysis revealed that the token’s Relative Strength Index (RSI) registered an uptick.
Realistic or not, here’s APT market cap in BTC’s terms
Its Money Flow Index (MFI) also followed a similar increasing trend, which indicated that Aptos might register greens on its price chart soon.
The technical indicator MACD also supported the buyers, as it displayed a bullish advantage in the market.