
- APT’s press time position near the confluence of the 20 EMA, 50 EMA, and the lower trendline of the rising wedge pattern can set the stage for buyers to re-enter the market.
- The altcoin could continue its long-term downtrend after a likely revival in the near term should it see a patterned breakdown.
Aptos [APT] stood at a critical point on its daily chart at press time, resting on the confluence of the 20 EMA, 50 EMA, and the lower trendline of a rising wedge pattern.
This technical setup suggested that APT could see a near-term recovery. At the time of writing, APT traded at nearly $6.7, up by almost 8% over the past week.
Why APT was at a critical juncture
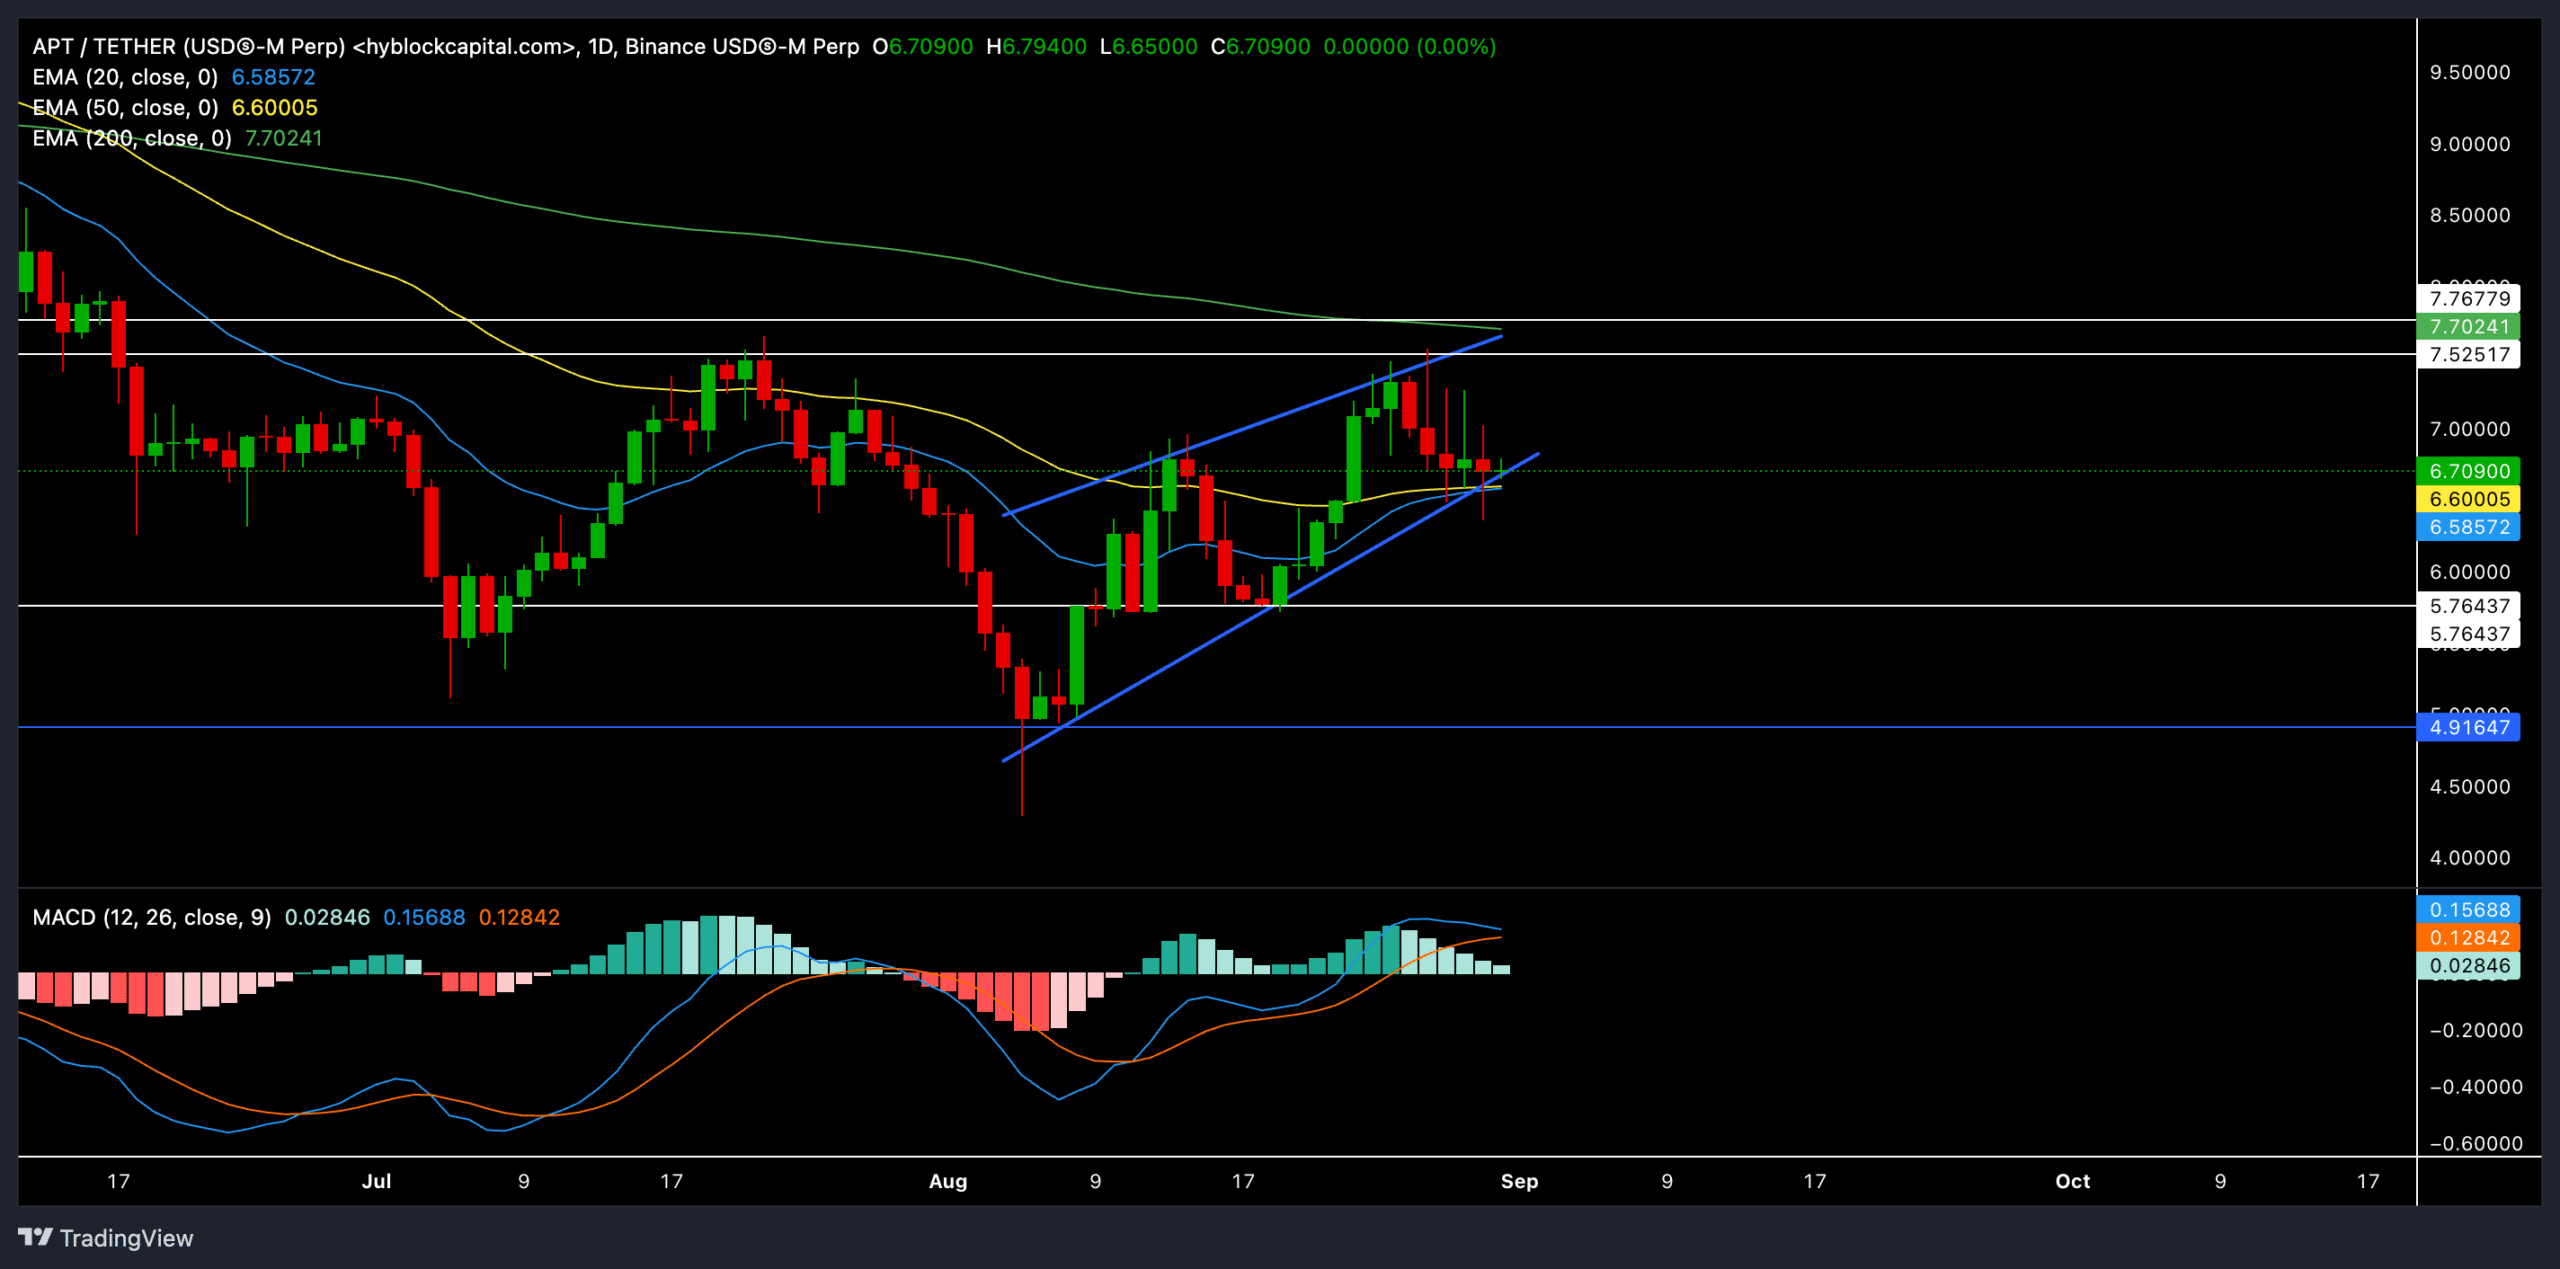
Source: APT/USDT
If the buyers manage to hold the price above the 20 EMA and 50 EMA, APT could retest the upper boundary of the wedge. The first major resistance in this bullish scenario lies near the $7.2 region.
A breakout above this level could open the doors to further gains, possibly driving the price toward the next resistance level at $7.7 (near the 200-day EMA).
On the flip side, a decisive close below the rising wedge pattern could expose APT to a more substantial downside risk. In this case, the first major support level lies around $5.7.
The daily chart’s MACD (moving average convergence divergence) showed a narrowing gap between the MACD line and the signal line, which could indicate an upcoming shift in momentum.
If the MACD line crosses below the signal line, it could signal increasing bearish pressure—supporting the case for a breakdown below the wedge.
However, should the MACD line continue to hover above the signal line, the bullish momentum might persist, helping the buyers push APT higher.
Derivatives market insights

Source: Coinglass
It’s worth noting that the trading volume has decreased by 28.56% over the past day. This might indicate waning interest, which could weaken the bulls’ attempt to push the price higher.
Open interest also declined by 4.34% to $96.75M. A drop in open interest could imply that traders are closing their positions, potentially decreasing volatility.
Read Aptos’ [APT] Price Prediction 2024-25
The long/short ratio was 0.9592 at the time of writing—confirming a slight bearish tilt in market sentiment. But this ratio is close to equilibrium and could easily swing in either direction depending on the upcoming price action.
Traders should now closely monitor the price action around the current EMAs and the wedge pattern. A clear break in either direction could provide a strong trading opportunity.