MOVE price hikes 7% in 24 hours, 33% up from weekly lows – What next?
A bearish reversal at the nearby resistance zone appeared more likely due to price structure and lack of buying pressure.

- MOVE has a bearish structure on the 4-hour chart despite the recent bounce from the lows.
- The liquidation heatmap underlined the $0.55 level as a key resistance zone.
Movement [MOVE] has bounced 33% from the past week’s low at $0.37, but it maintained its bearish near-term outlook. The buying pressure was not enough to breach the key resistance at $0.55. Further north, the $0.616 level marked the level whose breach would mark a structural shift for MOVE.
The trend of Bitcoin [BTC] was strongly bearish. It might not have formed a bottom yet, which meant Movement price could also dive lower in case of another wave of selling for BTC.
Hence, traders can maintain a bearish outlook for the coming week.
Conditions MOVE’s price must be met to shift the outlook
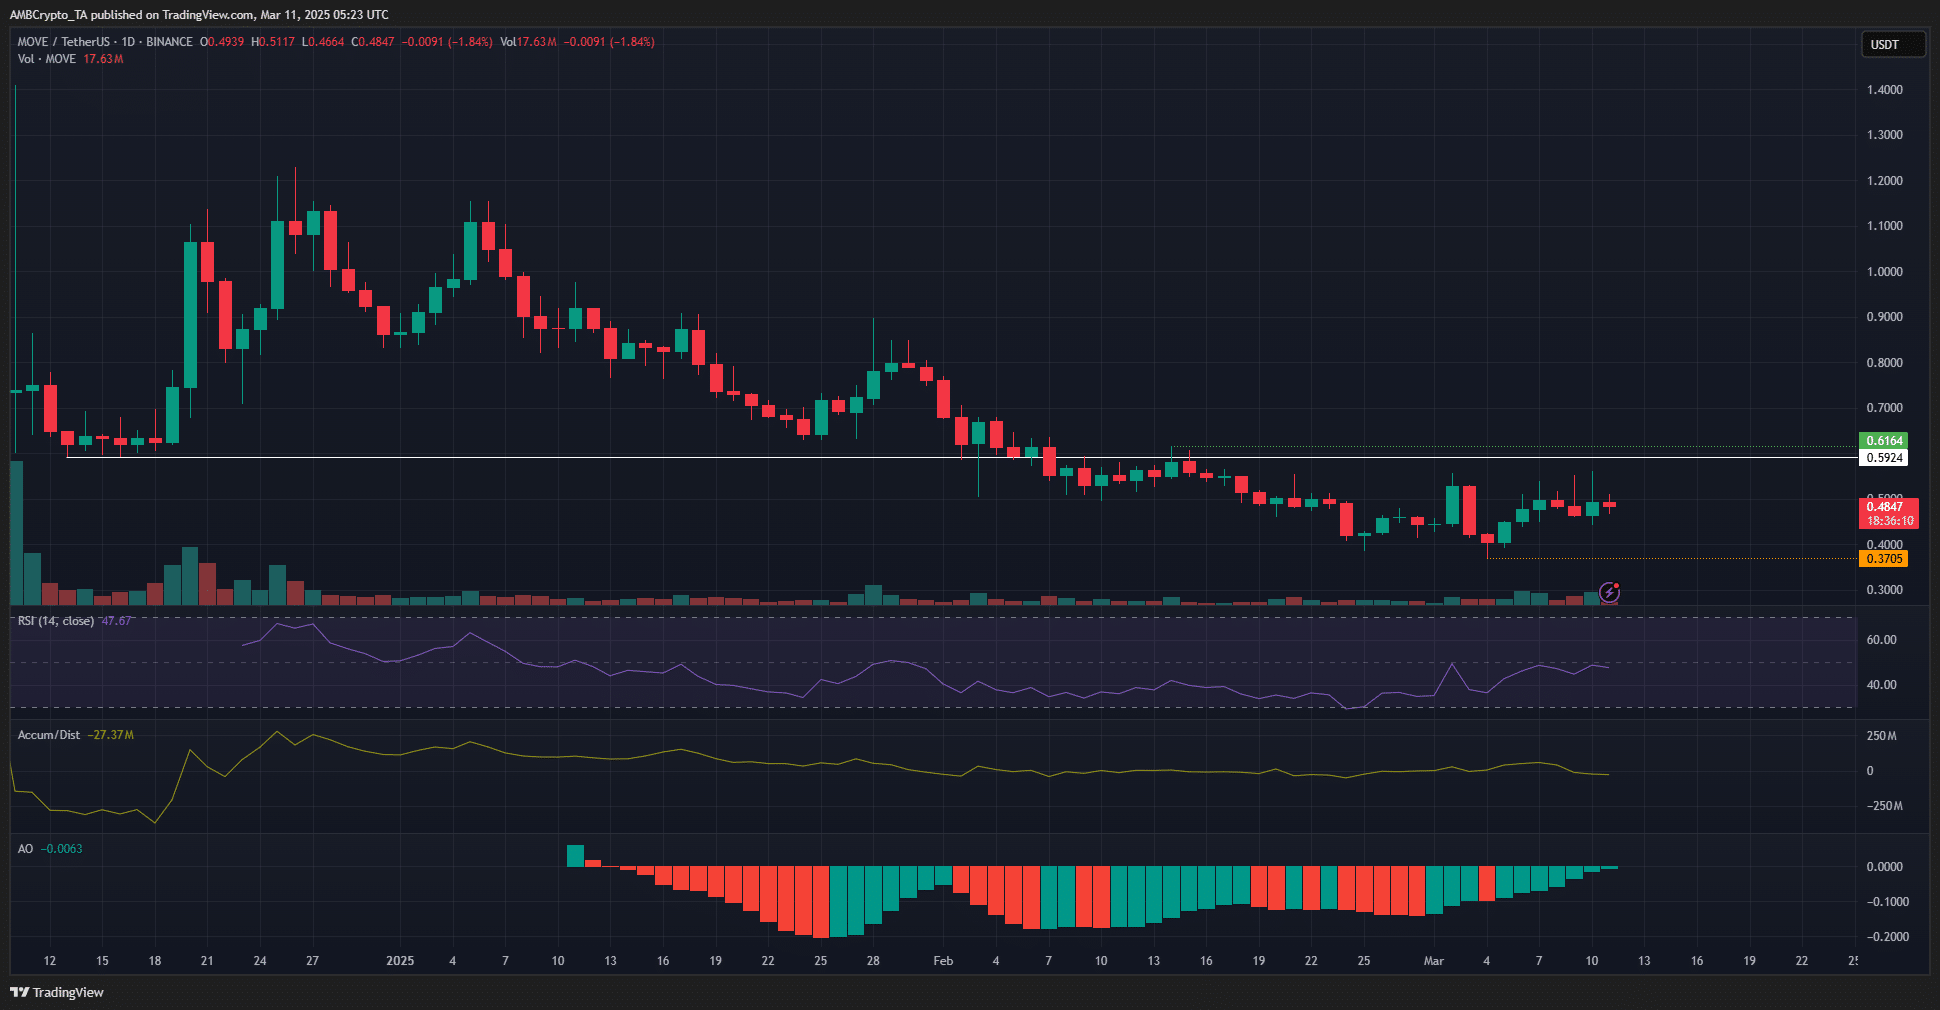
MOVE’s market structure remains bearish, with a recent lower high on the 4-hour chart at $0.616. A session close above this level could signal a bullish shift.
On the downside, the lower low at $0.37 is critical—falling below this level would confirm the continuation of the downtrend.
On shorter timeframes, the $0.53 level is notable. Previously a support, it now acts as resistance, with the $0.53–$0.55 zone likely to challenge bulls in the near term.
The Awesome Oscillator suggests a potential momentum swing, while the RSI sits at 47 and is approaching 50, signaling a possible buyer advantage. However, the A/D indicator shows no clear trend, with gains from early March fading back to February levels.

The past month’s liquidation heatmap identified $0.55 as the strongest magnetic zone, with a smaller liquidity cluster at $0.52. The price is likely to move upward and sweep the $0.55 level soon.
However, whether the short-term bullish momentum can be sustained beyond this point remains uncertain. A bearish reversal seems more probable due to weak buying pressure and the overall market structure.
Disclaimer: The information presented does not constitute financial, investment, trading, or other types of advice and is solely the writer’s opinion