Aptos pushes Polkadot off the development ranks despite APT’s…

- Aptos was rated above Polkadot in daily development activity.
- The APT price could face further decline as the ADX remained weak.
Aptos [APT], the project built with the aim of processing 150000 transactions per second, ranked first in terms of daily development activity on 19 February.
According to ProofofGitHub, the milestone meant that Aptos shifted the Polkadot [DOT] long-term lead per the metric.
GitHub Daily Development Activity:
#1: 162 Aptos
#2: 161 Polkadot / Kusama
#3: 102 Lido DAO Token
#4: 102 Lido Staked ETH
#5: 101 Zus
#6: 92 IOTA
#7: 78 Cosmos
#8: 73 NEM
#9: 69 Decred pic.twitter.com/65IvcyHMgY— ProofofGitHub (@ProofofGitHub) February 19, 2023
Read Aptos’ [APT] Price Prediction 2023-2024
Over a couple of weeks, DOT has been the leader in this regard, with only Cardano [ADA] pushing it to second on a number of occasions.
Although it was a close call between APT and DOT, the minimal difference showed that Aptos’ domination over others has been unwavering. But what has been the driving force behind the shoot?
Contributing in their droves
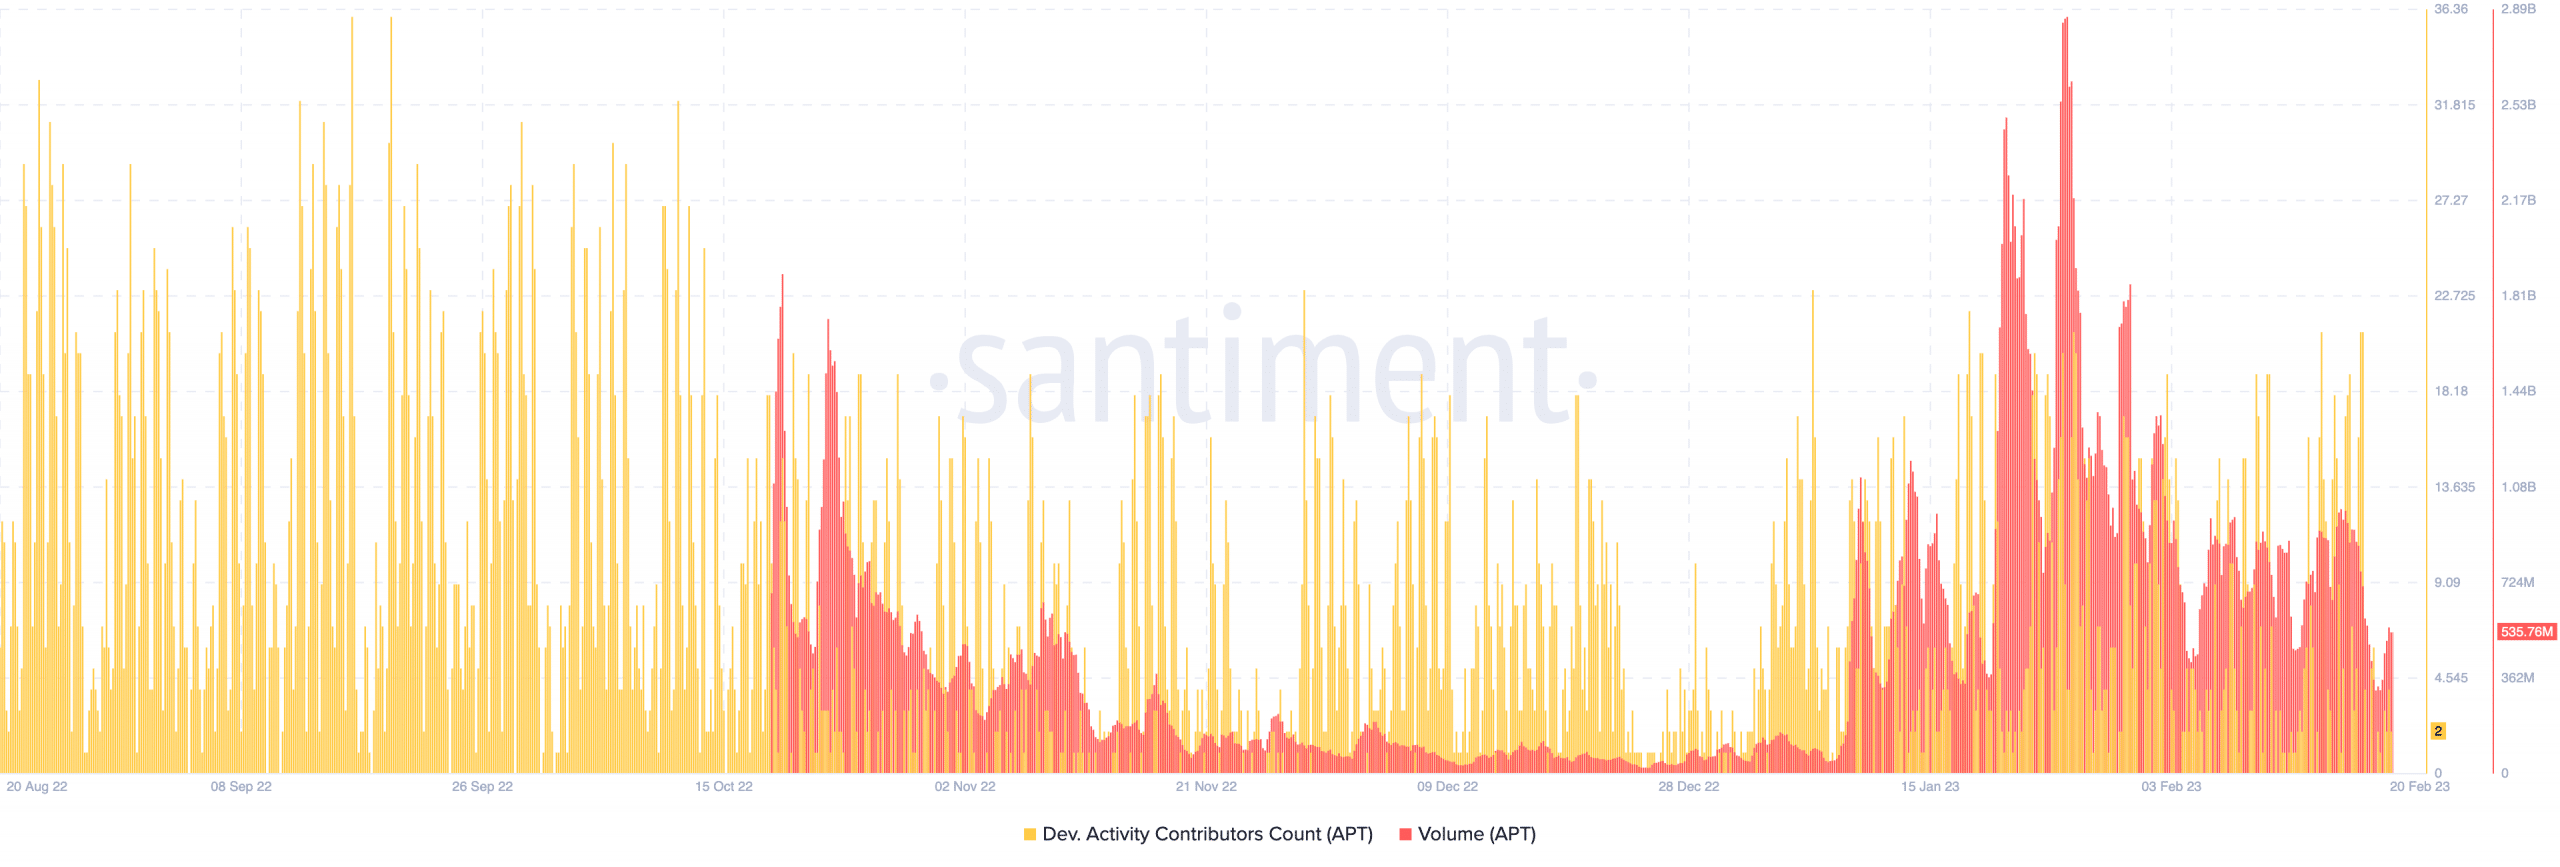
Interestingly, the push was possible due to the manner in which Aptos developers have increased their input. According to Santiment, the development activity contributors count has hit peaks over the last few days. As of 18 February, the metric hit as high as 20.87.
And, this has occurred despite Aptos not announcing any noteworthy upgrade. In addition, the Aptos on-chain volume had increased to 534.84 million at press time.
The volume describes the aggregate amount of tokens that pass through the network on a daily basis. Thus, the spike implied that a lot of tokens had exchanged wallets via the Aptos network within the last 24 hours.
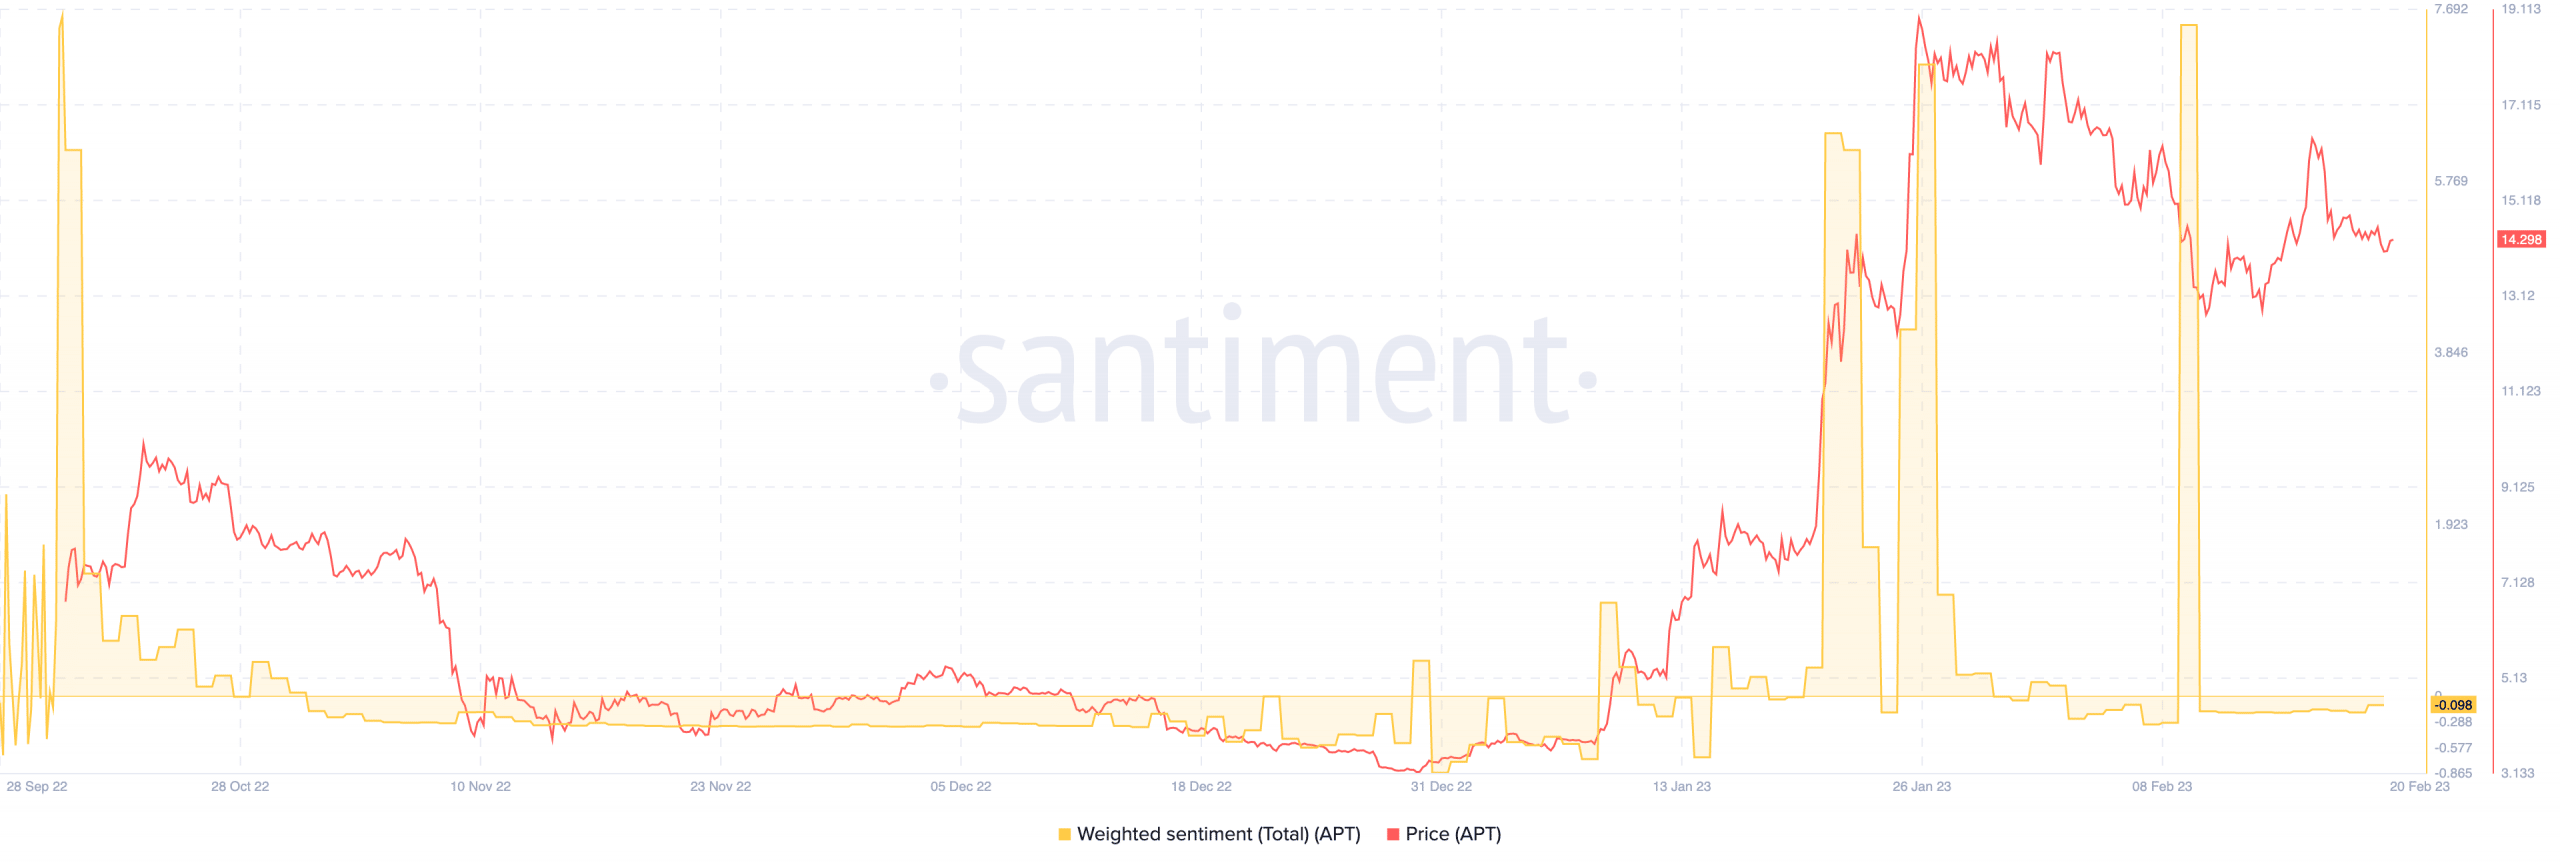
Despite increases in the aspects mentioned above, there was some stagnancy with APT that could not be overlooked. For context, the weighted sentiment has been around the same spot since 10 February.
The weighted sentiment gauges how well the vast majority of messages on social networks performed.
But since it has been at a low state, it means that APT has rarely enjoyed social attention. At press time, the APT token traded at $14.29. So, what should holders expect of the token in the short term?
APT: Optimism on a low
As per the four-hour chart, APT’s volatility was contracted to extremely low levels as displayed by the Bollinger Bands. However, the APT price touched the lower bands, indicating an oversold condition, and bound in a tight trading pattern.
How many are 1,10,100 APTs worth today?
Concerning momentum, the Relative Strength Index (RSI) was 45.71, trending toward a neutral stance. In terms of direction, APT could possibly head further into the bearish zone since the -DMI (red) superseded the +DMI (green) position.
But the Average Directional Index (ADX) was at 12.35. The ADX (yellow) describes the directional strength, and a value of 25 and above signifies a strong one. Since the ADX value was low, it inferred that there was no stone support for either the bulls or bears.


![Aptos [APT] price action](https://ambcrypto.com/wp-content/uploads/2023/02/APTUSD_2023-02-20_09-32-13.png)


