Will Polkadot’s [DOT] development activity be enough for the ecosystem? Assessing…

- Polkadot’s trading volume was declining at press time.
- Metrics and market indicators looked bearish.
Token Terminal revealed that Polkadot’s [DOT] trading volume was on a constant decline, which was a negative signal. However, in terms of the number of developers, DOT has consistently outperformed its competition, with the figure increasing since its inception. But will DOT’s development activity be enough to maintain the overall health of the blockchain?
Active core developers on @Polkadot & DOT trading volume: pic.twitter.com/3ZlJ29NQqC
— Token Terminal 📊 (@tokenterminal) February 13, 2023
Read Polkadot’s [DOT] Price Prediction 2023-24
Polkadot Insider posted the ecosystem’s weekly report on 13 February, which highlighted several new statistics about the network. For instance, despite the decline in trading volume over the past months, DOT’s revenue registered an uptick in the last week as it spiked on 10 February. The report also mentioned that DOT’s staking value exceeded $598 million and its inflation rate was 70.17%.
👀 Let's get to know the on-chain weekly recap of @Polkadot 👇
The below picture illustrates:
👉Daily transfer amount
👉Total revenue
👉Social Performance#Polkadot #DOT $DOT pic.twitter.com/c44hiiAmWT— Polkadot Insider 🐂⭕️ (@PolkadotInsider) February 13, 2023
Metrics look concerning
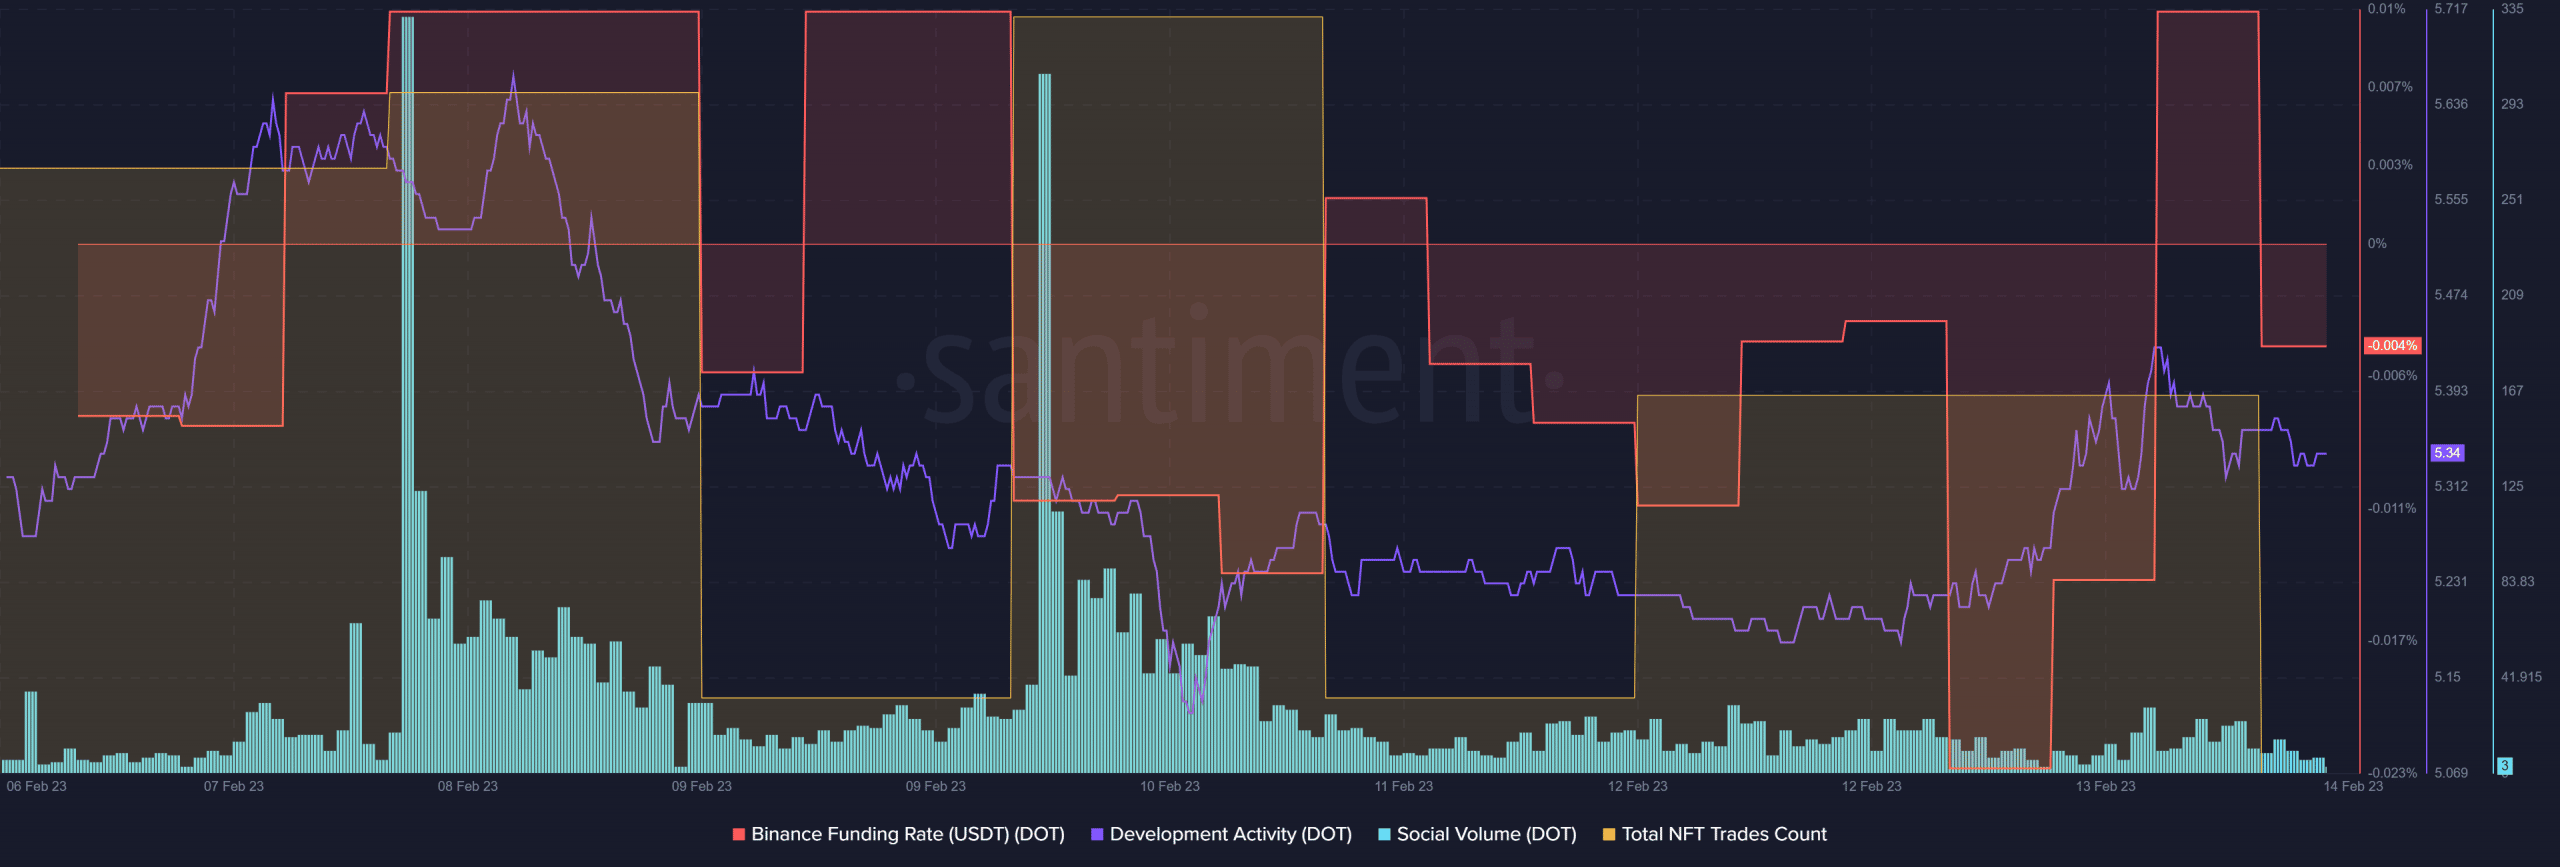
Over the last week, DOT’s development activity registered a decline, which was surprising considering DOT’s past performance. Besides that, DOT’s Binance funding rate remained relatively low throughout the week, reflecting less demand from the derivatives market.
DOT’s popularity also got affected last week, which was evident from its declining social volume. Polkadot also registered little growth in its NFT space, as its total number of NFT trade counts declined.
A further decline is possible for DOT
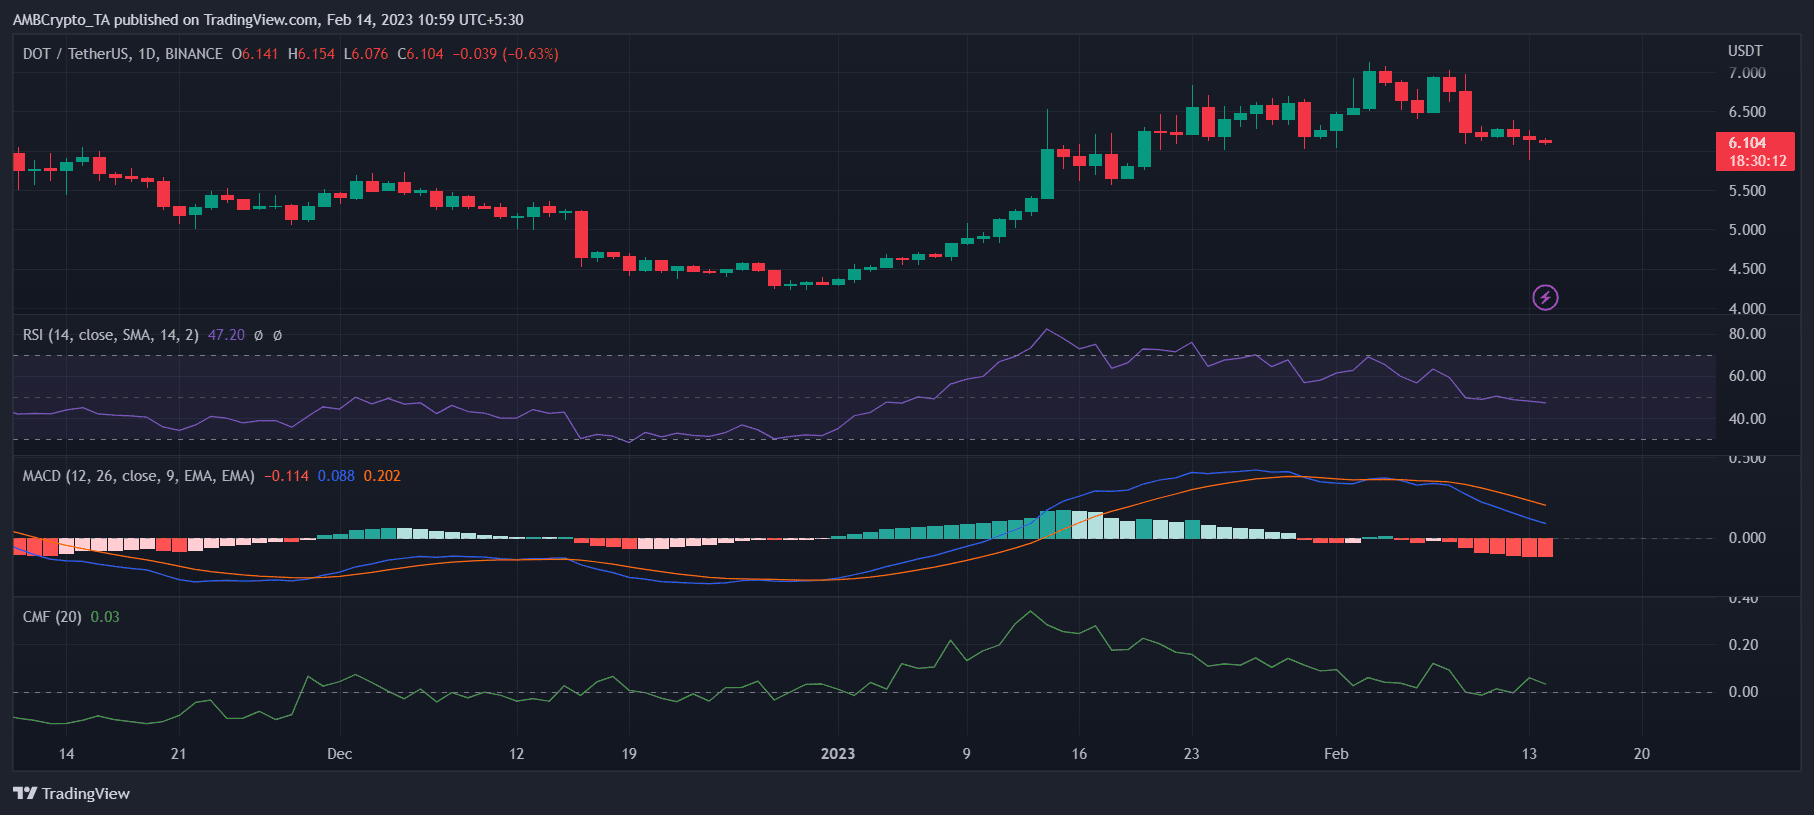
DOT’s performance on the price front also did not align with investors’ interest, as its weekly chart was red. According to CoinMarketCap, DOT’s price declined by over 7% in the last seven days, and at the time of writing, it was trading at $6.11 with a market capitalization of over $7 billion.
Is your portfolio green? Check the Polkadot Profit Calculator
A look at DOT’s daily chart revealed a bearish advantage, which could increase the chances of a continued downtrend in the near term. For instance, DOT’s Relative Strength Index (RSI) registered a downtick and was heading further below the neutral mark, which was a development in the sellers’ favor.
The Chaikin Money Flow (CMF) also went down. Furthermore, DOT’s MACD displayed a bearish crossover, which also suggested the possibility of a price plummet in the coming days.