Aptos traders can monitor these two price levels for the next move
The spot CVD remained in a downtrend and did not support the idea of hefty demand for Aptos and questioned the idea of a rally for the token.

Disclaimer: The information presented does not constitute financial, investment, trading, or other types of advice and is solely the writer’s opinion.
- Aptos has a bearish outlook on the higher timeframe price charts.
- The recent gains could easily be wiped out if it was not backed by genuine demand for APT.
Aptos [APT] saw its market structure flip bearishly on the daily timeframe on 15 August. A month ago, APT was trading at $6.1, but at the time of writing it was valued at $5.3. Over the past two weeks, this trend appeared to slow down.
Is your portfolio green? Check the Aptos Profit Calculator
In other news, the Aptos blockchain announced a partnership with Flowercarbon to align itself with the climate change agenda. The partnership is aimed at pushing APT toward sustainable practices.
Aptos threatens a structural break with gains of over 8%
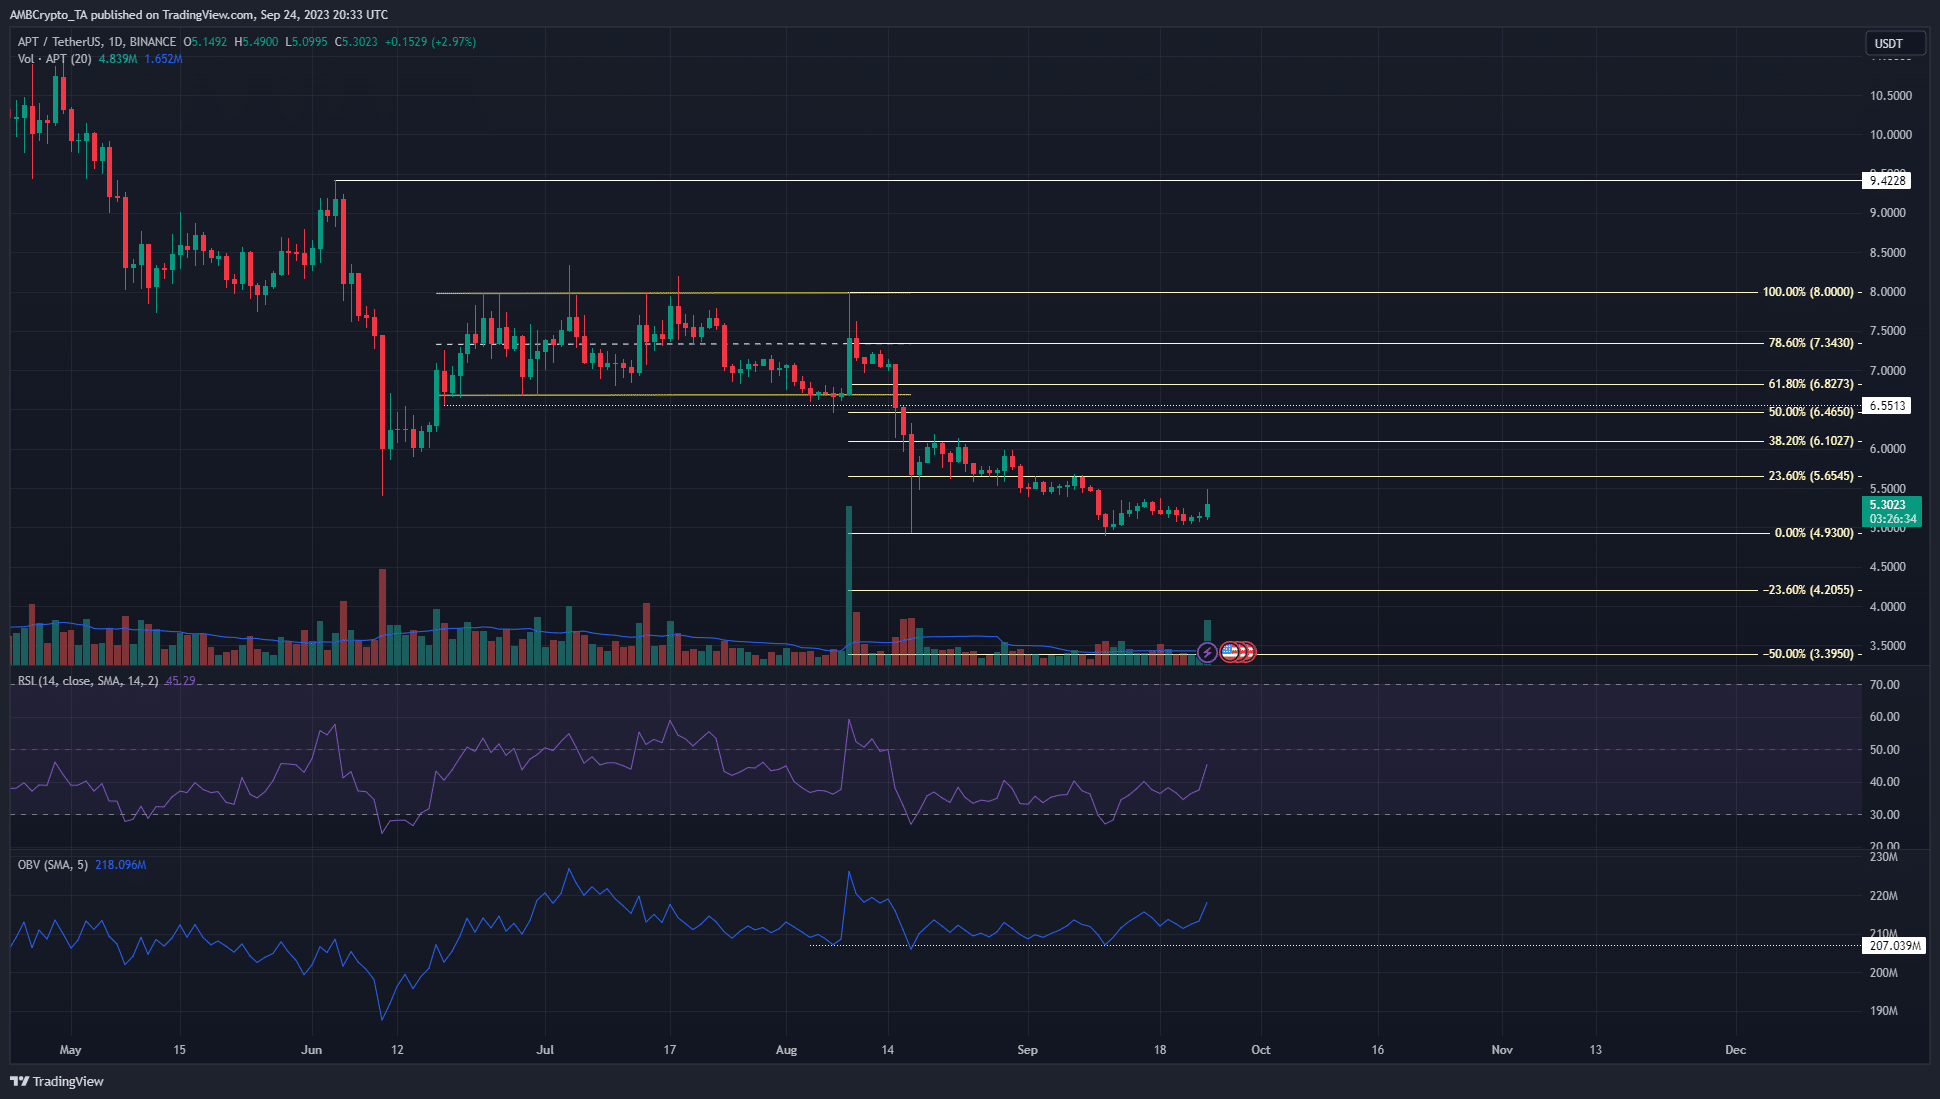
On Sunday, 24 September, APT saw a large bullish swing in the lower timeframe price charts. Within 20 hours the token noted gains of 8.3%, climbing from $5.07 to $5.49. On the daily chart, the previous lower high sat at $5.36.
Hence, this surge higher was one of two possibilities- a sign of bullish intent and the beginning of a retracement of the losses of the past month, or a northward liquidity hunt before further losses in value. The RSI remained below neutral 50 to indicate a downtrend in progress.
The market structure of APT on the daily chart remained bearish but will shift its bias upon a daily session close above $5.36. The OBV has noted some gains over the past week and signaled buyers entered the market with noticeable strength.
A move above $5.65 and its subsequent retest could offer a counter-trend buying opportunity. The take-profit targets would be the 61.8% and 78.6% Fibonacci retracement levels at $6.82 and $7.34.
The Open Interest saw a wild swing higher
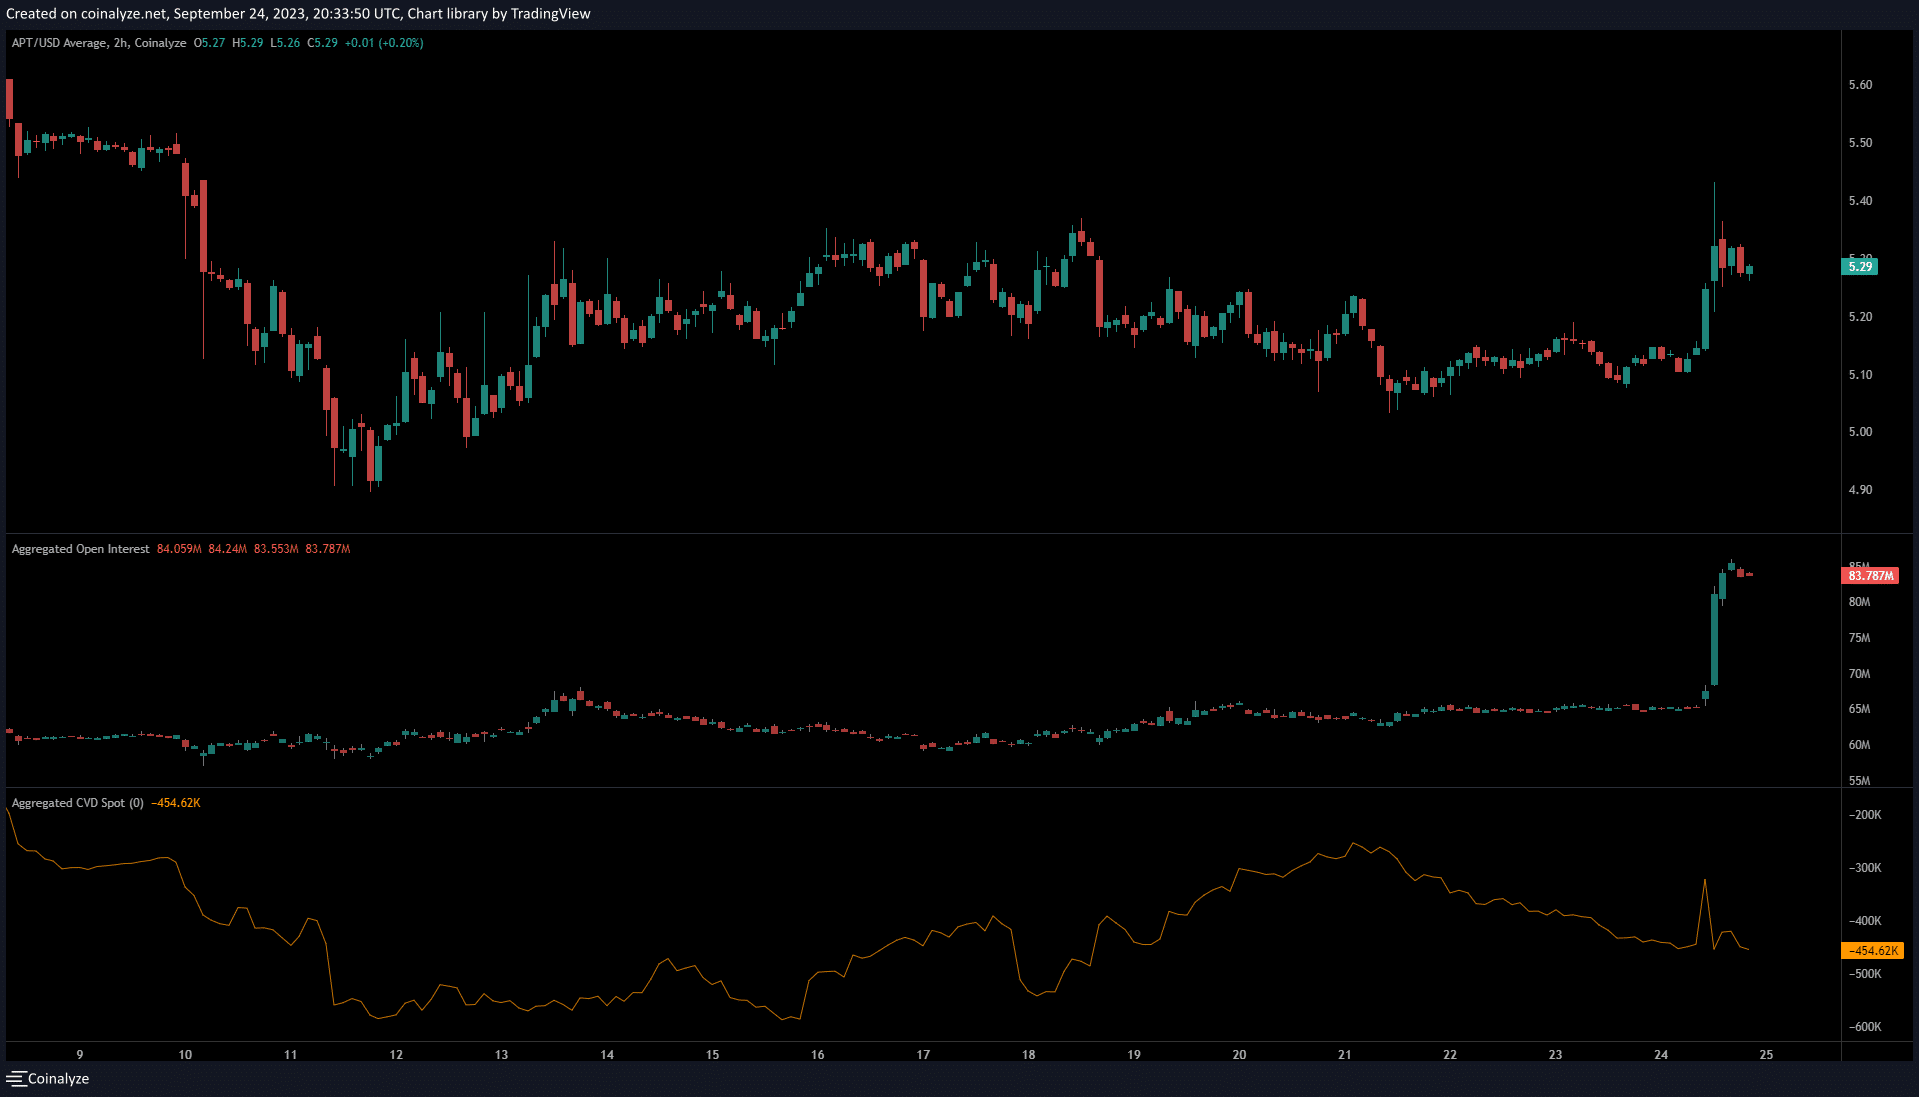
As noted previously, Aptos posted large gains and nearly reached the $5.5 mark. This saw speculators go into a bullish frenzy. The Open Interest noted a spike from $65 million to $85 million. It was a huge sign that speculator sentiment was bullish- but were they right?
Realistic or not, here’s APT’s market cap in BTC terms
The spot CVD remained in a downtrend and did not support the idea of hefty demand. Combined with the importance of the $5.36 and $5.5 levels in the lower timeframe charts, the recent spike could have been a bull trap and we could see a drop in Aptos prices.
A drop below the $5.03 mark would be indicative of a continuation of the bearish higher timeframe trend.


