Arbitrum [ARB] Price Analysis: 30 March

Disclaimer: The information presented does not constitute financial, investment, trading, or other types of advice
- The short-term momentum was strongly bullish
- The resistance at $1.42 could halt the buyers, at least temporarily
Arbitrum (ARB/USD) has seen significant price movements in recent times, trading at $1.25 on March 23, 2023, and at $1.39 at press time after gaining by 15% in the last 18 hours. With a market cap of $1.7 billion, the crypto-token ranks 34th on CoinMarketCap. This analysis will examine key technical indicators on the 1-hour timeframe to gauge the short-term momentum behind ARB and predict where the market could be headed next.
Is your portfolio green? Check the Arbitrum Profit Calculator
Arbitrum has an ambitious 2023 roadmap, one that includes launching its layer-three solution called Orbit and enabling developers to deploy programs written in popular programming languages like Rust and C++.
The bulls sat firmly in the driving seat on the price charts
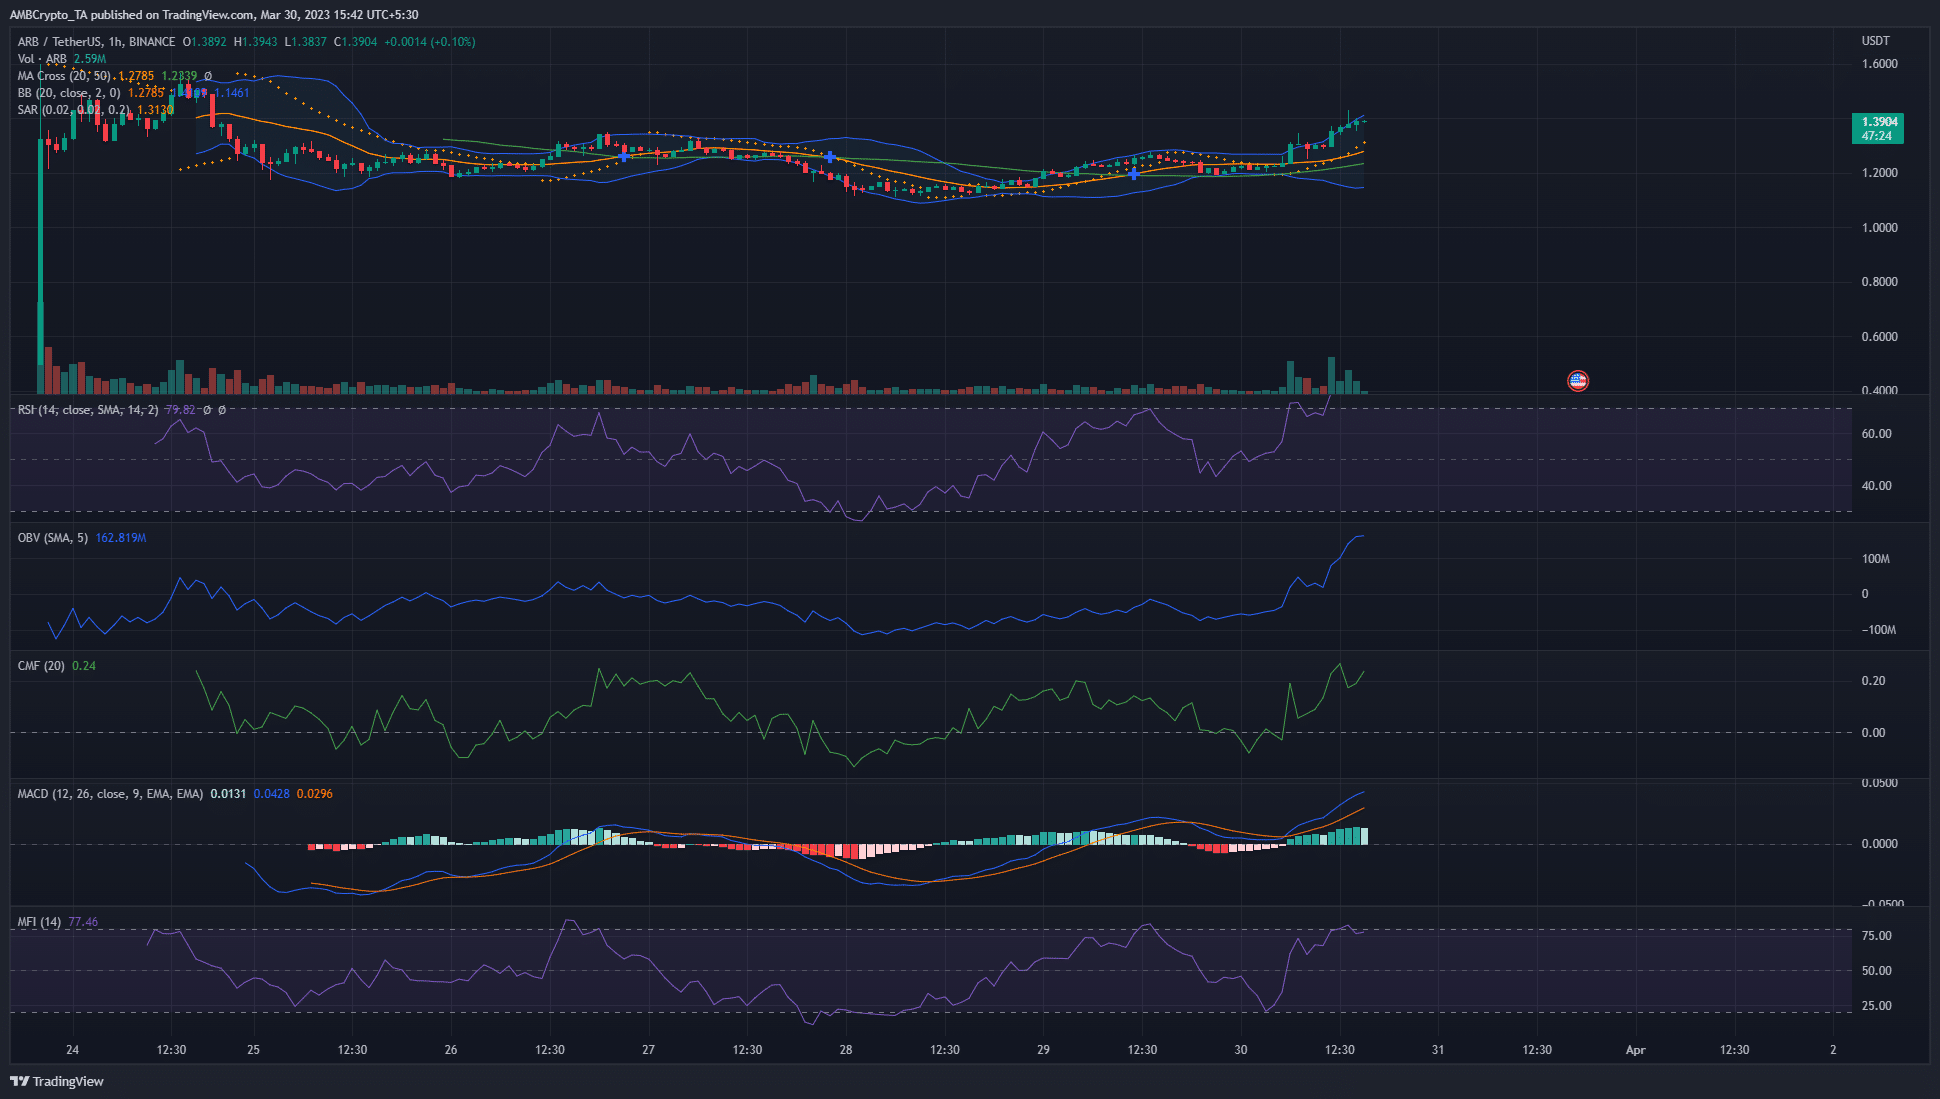
Looking at the technical indicators, the RSI stood at 79.8, suggesting overbought conditions in the market. The Bollinger Bands were swiftly diverging, indicating increased price volatility and potential continuation of the prevailing trend. The OBV at 162.8 million registered a strong uptick over the past two days, highlighting the hike in buying pressure in the market.
Key Highlights –
- RSI at 79.8, indicating overbought conditions
- Bollinger Bands swiftly diverging, suggesting increased price volatility
- OBV at 162.8 million, with the same recording a strong uptick in the past two days
- CMF at +0.24, pointing to significant buying pressure
- Moving Averages: 20 SMA at 1.2785, 50 SMA at 1.2339; press time price at $1.39
- MACD above zero line and climbing higher after forming a bullish crossover
- MFI at 77.4, suggesting an overbought market
- Parabolic SAR’s dots below price candles, signalling a short-term bullish trend
- Significant support levels – $1.29 and $1.18
- Significant resistance levels – $1.42 and $1.57
On March 16, 2023, Arbitrum announced its highly anticipated ARB token airdrop, distributing 12.75% of the total supply to early users and DAOs building on Arbitrum. The project claims to offer advantages over other optimistic rollup solutions, such as compatibility, scalability, flexibility, and decentralization.
Continuation of the short-term bullish pressure could drive prices past $1.5
The CMF at +0.24 confirmed the presence of significant buying pressure. The moving averages showed the 20 SMA at 1.2785 and the 50 SMA at 1.2339, both below the press time price of $1.39, supporting the prevailing bullish momentum. The MACD was above the zero line and climbed higher after forming a bullish crossover, indicating a positive short-term trend.
How much are 1, 10 or 100 ARB worth today?
The MFI at 77.4 suggested an overbought market, which could signal a potential pullback or consolidation. However, the Parabolic SAR dots were below the price candles, confirming the short-term bullish trend. Traders should closely monitor the significant support levels at $1.29 and $1.18 and the resistance levels at $1.42 and $1.57.
In conclusion, the current technical indicators for ARB/USD seemed to signal a short-term ‘buy’ trading signal. The swiftly diverging Bollinger Bands, high RSI, and rising OBV suggested that the market is seeing strong bullish momentum. However, traders should exercise caution as the high RSI and MFI values indicate overbought conditions. These could result in a potential pullback or consolidation.


