Arbitrum looks to $0.285 after gaining 21% – But THIS level comes first
The falling volume trends was a concern but the price structure remained bullish.



Arbitrum [ARB] has rallied 5.28% on Sunday, the 11th of October. Bitcoin [BTC] also experienced a 0.95% move on Sunday, bouncing from $82,988 to $83,773. This minor move helped the altcoin market cap expand by 1% to reach $1.12 trillion.
Arbitrum had already been trending higher, gaining 21.34% since the low at $0.162 made on the 8th of October.
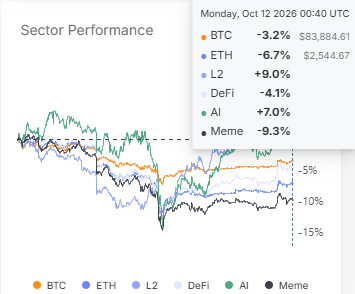
Layer 2 tokens have been trending strongly in recent days, Glassnode data showed. They have outperformed Bitcoin and the other top crypto market sectors by a sizeable margin.
As an L2 token, ARB’s price move was partially explained by the capital flow into the sector. Over the past two weeks, the market-wide correction has affected altcoin market sentiment.
The price action highlighted why Arbitrum remains a bullish altcoin.
Arbitrum bulls gear up for another push higher
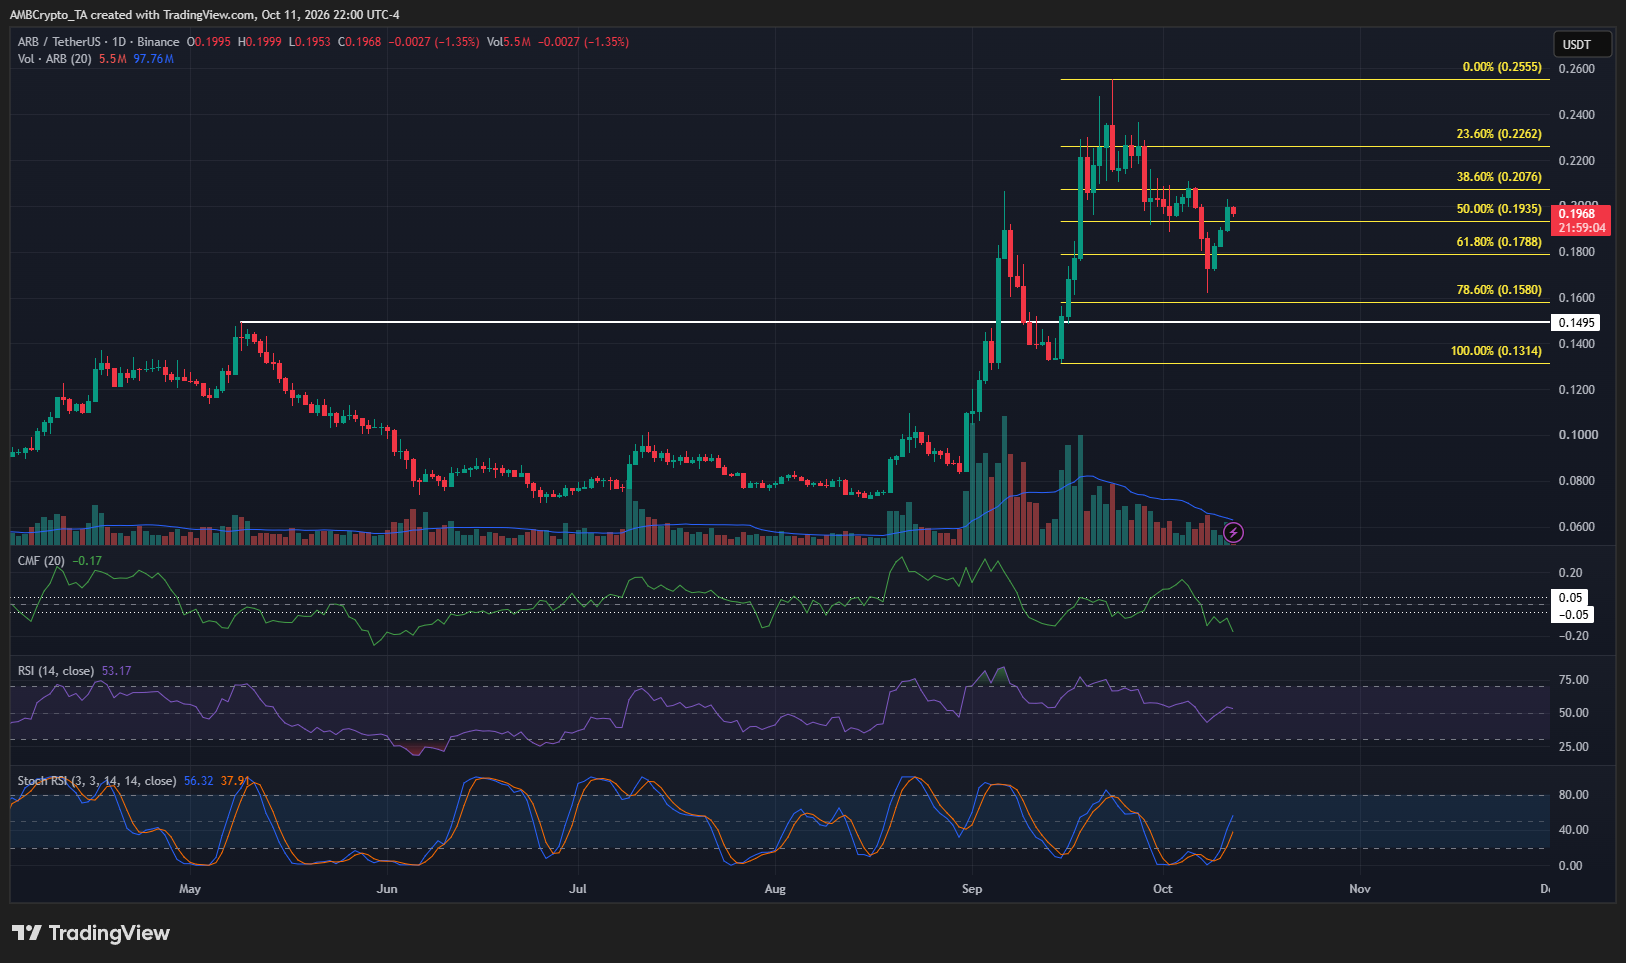
On the 1-day timeframe, the swing structure flipped bullishly in early September when the $0.1495 swing high from May was broken. After a pullback to $0.131, the uptrend continued.
Buffed by rising network activity and accelerating revenue, ARB prices made another swing high to reach $0.255, keeping the bullish structure intact. Once again, the price had pulled back into a demand zone around $0.16 and reacted positively.
It was a slight concern that the CMF on the daily timeframe was below -0.05, even as daily trading volume shrank noticeably over the past six weeks. Yet, structurally, ARB has a bullish bias on this timeframe.
Traders’ call to action – Wait to buy
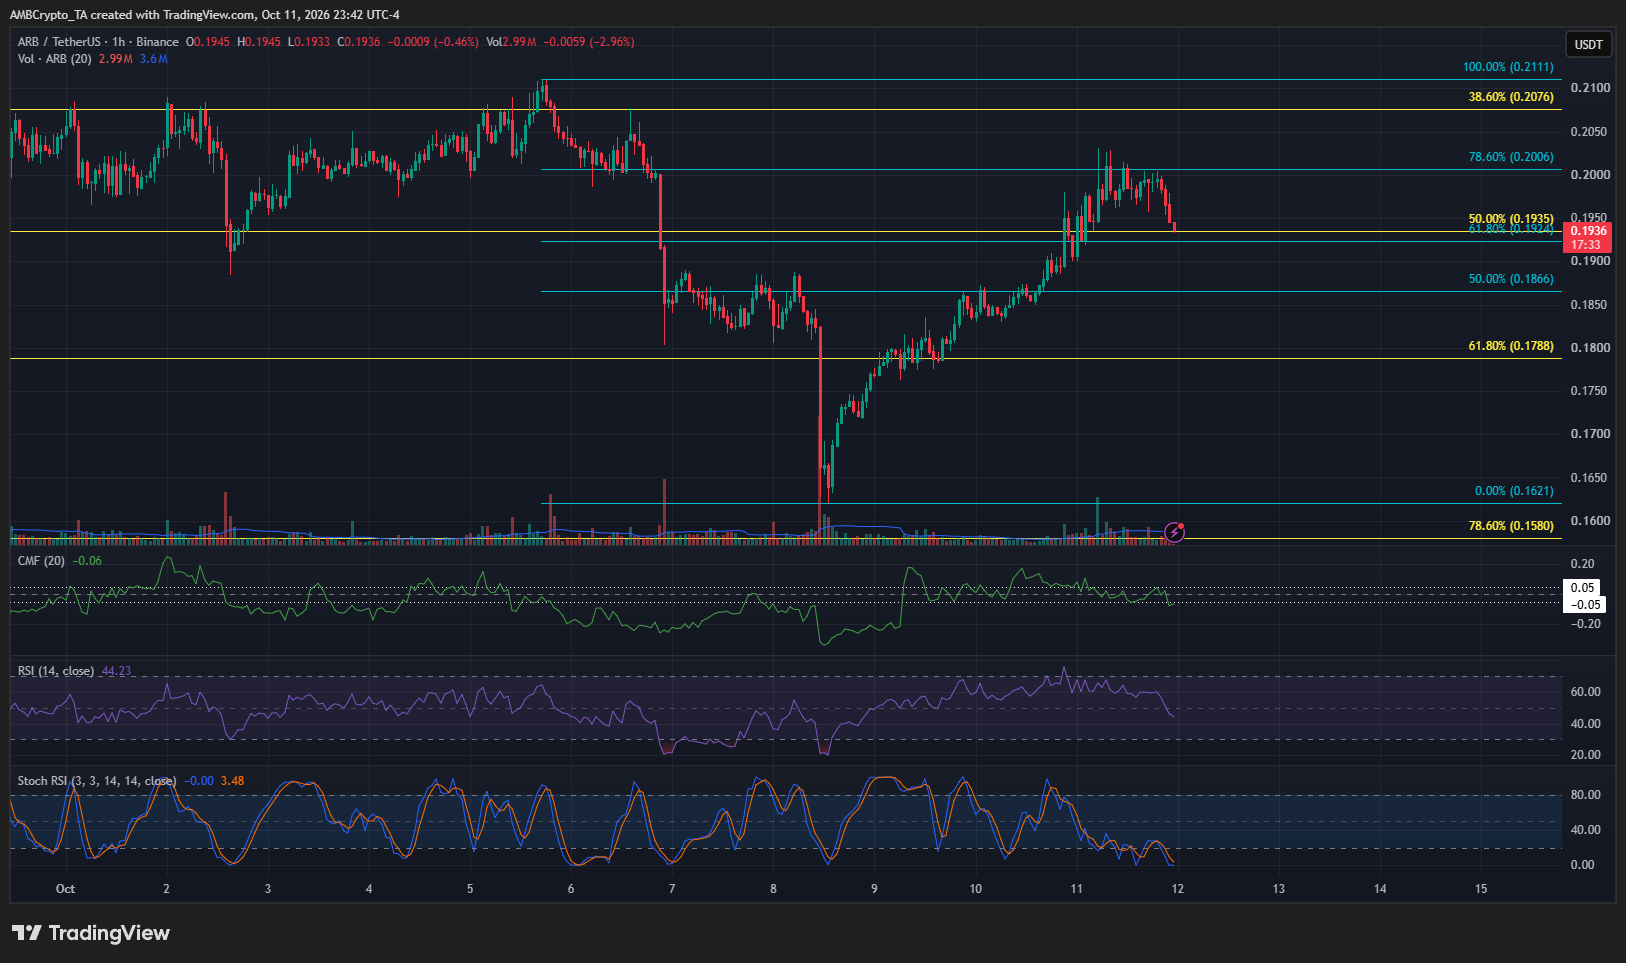
The swing structure on the 1-hour timeframe was bearish. Technically, buyers can wait for a breakout past $0.211 and a retracement below $0.186 to buy. However, they might not get such a clean setup, especially if the Bitcoin correction to $80.3k is over and a new leg higher occurs over this weekend.
The $0.183-$0.186 area is an imbalance on the daily timeframe and also a local supply/demand zone. A retest of this region could offer a swing buying opportunity, targeting $0.255 and $0.285.
This bullish idea would be invalidated if ARB prices fell below $0.162.
Final Summary
- Arbitrum has benefited from the capital inflows to the Layer 2 sector, but ARB’s uptrend has been in place since August.
- The latest pullback to $0.162 was part of a healthy uptrend. The falling volume trend was a concern, but the price structure remained bullish.